
The Russell 2000 had a phenomenal Friday as rate-cut expectations were brought forward to March. Futures traders now expect five cuts next year – unlikely unless the US economy craters, in which case small-caps will take the brunt of the contraction anyway.

In October, the Actual Earnings Changes sub-index, which reflects small-business profit trend, under the NFIB Optimism Index tumbled eight points month-over-month to minus 32, not too far away from the lows of minus 33 in August 2022 and minus 35 in June 2020. The all-time low of minus 45 was hit four times between January and July of 2009; the US was in the process of exiting the great financial crisis recession then. In 2020 as well, when the sub-index dropped to minus 35, the economy was coming out of the Covid-19 recession.
This time around, the sub-index remains suppressed even as the US economy is churning out decent numbers. It is anyone’s guess as to where it might be headed as the economy decelerates in the quarters ahead. Next year, the economy probably softens quite a bit in a best-case scenario and contracts in the worst.
The profit trend is in line with the overall index which dropped one-tenth of a point m/m in October to 90.7. In April, the NFIB Optimism Index hit 89, which was the lowest since January 2013 when it printed 88.8. The all-time low of 81.6 was reached in March 2009 (Chart 1).

Back then, the Russell 2000 bottomed in that very month – March 2009 – ticking 343, having peaked at 856 in July of 2007. The recession ended in June 2009.
The small cap index’s most recent peak was posted in November 2021 when it tagged 2459. It then tumbled all the way to 1641 which was hit in June last year.
Despite the trough a year and a half ago, the Russell 2000 has struggled to gain momentum. After the June 2022 bottom, it rallied the next couple of months to peak in August at 2030, which is yet to be surpassed. February and July this year came close but ended up forming lower highs (2007 and 2004 respectively). On the other hand, the June 2022 low was retested in October last year (1642) and in October this year (1634).
In contrast, at last Friday’s high the Nasdaq 100 was merely 3.7 percent from its record high from November 2021 and the S&P 500 large cap index was 4.8 percent from its record high from January 2022. The Russell 2000 is 32 percent from its record high set more than two years ago – still trapped in a 200-point range between 1700 and 1900 in place since January last year (Chart 2).
Amidst this, a ray of hope was rekindled among small-cap bulls last Friday when the Russell 2000 shot up three percent to 1863 – past its 200-day moving average (1819) as well as the mid-point of the 1700-1900 range, which offered strong resistance in the past. The move came about as investor hopes grew that the Federal Reserve would begin to cut in the early months next year.
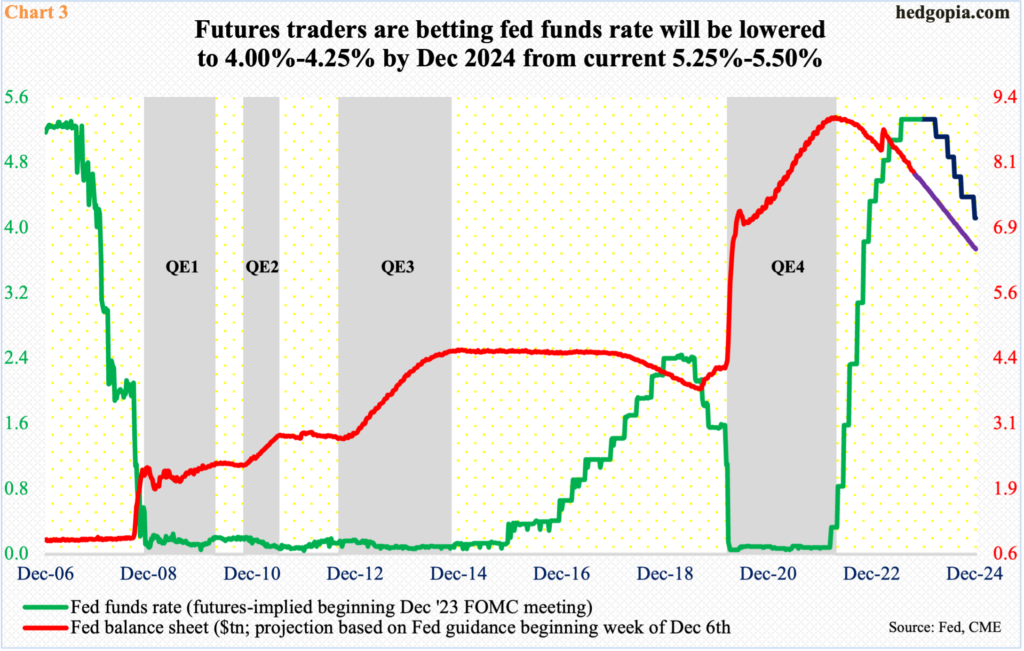
By nature, small-caps rely more on bank loans than the bond market to raise funds. Since March last year, interest rates have gone up a lot, as the Fed tightened aggressively to fight inflation. The fed funds rate went from a range of zero to 25 basis points in March last year to a range of 525 basis points to 550 basis points this July.
By all intents and purposes, the Fed is done tightening, even though it continues to reduce its balance sheet (Chart 3). Markets are now on pins and needles as to when the central bank might start cutting. Several months ago, futures traders were placing bets on the benchmark rates ending 2024 just below four percent. This was aggressive, and the Fed began to push back against this outlook. The traders began to vacillate. Until a couple of weeks ago, they were expecting three 25-basis-point cuts next year to end the year between 450 basis points and 475 basis points. This changed last week. They now expect five cuts, to a range of 400 basis points to 425 basis points.

Small-cap bulls last Friday aggressively bought into this rates outlook and rallied the Russell 2000 with aggression, although the index remains rangebound.
Here is the problem with this thesis. If the Fed were indeed to cut the benchmark rates by 125 basis points – even 100 basis points – next year, the economy would have to be in acute deceleration, in which case the sell-side’s earnings optimism for next year will get smoked.
As of the end of November, S&P 600 companies were expected to earn $72.06 in operations this year and $90.14 next (Chart 4). Last year, they brought home $75.96, meaning earnings would have gone down 5.1 percent this year. This at a time when the economy is growing. Next year, earnings are expected to surge 25.1 percent. At least that is how the sell-side sees it.
First, these analysts are notorious for starting out optimistic and then bring out the scissors as the year progresses. In June last year, 2023 was expected to ring up $111.23. Even 2024 estimates – as elevated as they still are – were $105.68 in March this year, before they were revised downward.
Second, next year’s estimates look suspect even in a normal environment. Next year will probably not be a normal year. As the Fed’s aggressive tightening campaign filters through to the nook and cranny of the economy, deceleration at best, and contraction at worst, is the path of least resistance. In this environment, it is safe not to bet on a sustained range breakout by the Russell 2000.
Thanks for reading!
