
Equity bulls often assert that this is the most hated bull market ever. There is some – with emphasis on ‘some’ – truth to that, particularly if we focus on short interest.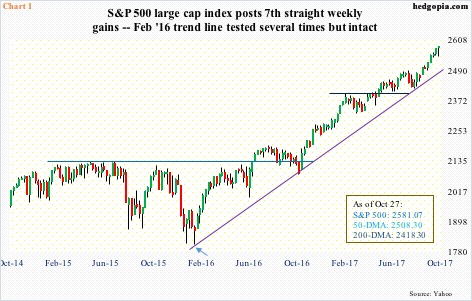
U.S. stocks reached an important bottom in January/February last year.
The S&P 500 large cap index bottomed at 1810.10 on February 11, 2016 (arrow in Chart 1). Through last Friday’s intraday high, it rallied nearly 43 percent, with several breakouts along the way, the most recent of which took place this May – out of 2400.
Leading up to that February 2016 bottom, shorts showed aggression.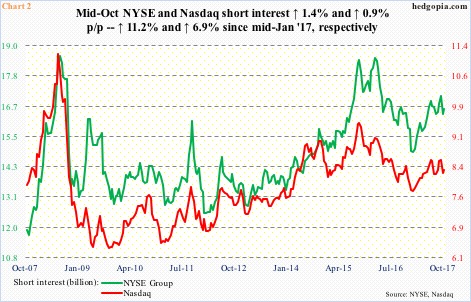
By the middle of February last year, NYSE short interest had ballooned to 18.5 billion, a stone’s throw away from record 18.6 billion at the end of July 2008. Soon followed short squeeze. Short interest bottomed at 14.9 billion mid-January this year (Chart 1). Since that low, it has once again been trending higher, up 11.2 percent through mid-October.
Shorts’ continued doubt about the sustainability of the rally has helped the bulls. Big time. From this perspective, yes, the rally has been hated.
And some hatred it has been.
In terms of duration, the current bull market, which began in March 2009, is 103.6 months old, second only to the October 1990-March 2000 bull lasting 113.4 months.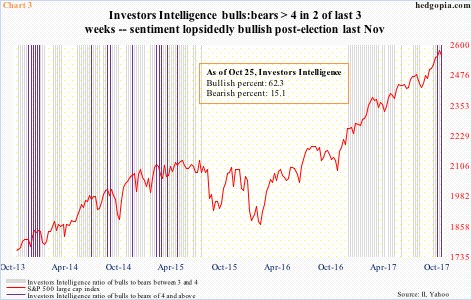
Apart from short interest, several other metrics suggest this bull is fully embraced.
For three consecutive weeks now, Investors Intelligence bulls have remained north of 60 percent, even as the bears are stuck with a 15 handle.
Chart 3 plots the S&P 500 with Investors Intelligence bull-to-bear ratios of three or above. In 32 out of 47 weeks beginning early December last year, the ratio registered a ratio of three or above, two of them four or above.
A ratio of four or above – represented by violet bars in the chart – flashed twice in the last three weeks. Before this, the last four-or-higher reading took place in April 2015.
In fact, the ratio began to persistently stay north of three beginning October 2013. This persisted until July 2015. Sentiment once again turned lopsidedly bullish post-presidential election last November. No hate, but lots of love.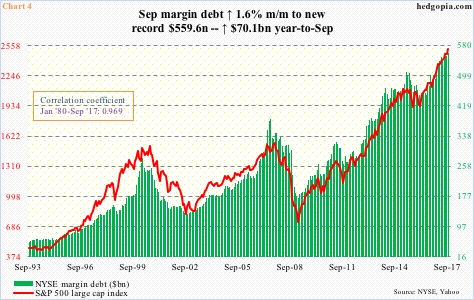
One gets the same feeling if we turn our attention to margin debt.
NYSE margin debt rose $8.8 billion month-over-month in September to $559.6 billion – a new high. October-to-date, the S&P 500 rallied another 2.5 percent, so it is possible the green bars in Chart 4 grew taller in October.
Year-to-September, margin debt went up by $70.1 billion, and by $123.8 billion from February 2016. The bull market in stocks has coincided with a bull market in margin debt. Correlation between the two is nearly one.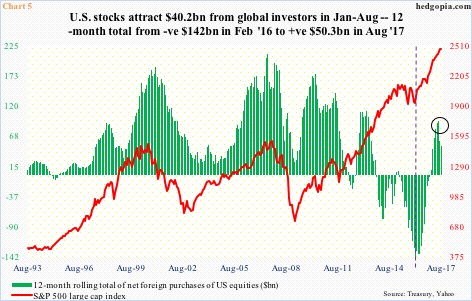
Or for that matter foreigners’ love for U.S. stocks.
Back in February 2016, on a 12-month rolling total basis, foreigners were net-selling $142 billion in U.S. stocks. Then they switched. The green bars in Chart 5 bottomed in that month, as did U.S. stocks.
By June this year, they were net-buying $94.3 billion worth. Since then, the 12-month pace has receded, but still healthy $50.3 billion as of August this year.
In three months through August, they net-sold $17.5 billion, but year-to-August they still purchased $40.2 billion worth.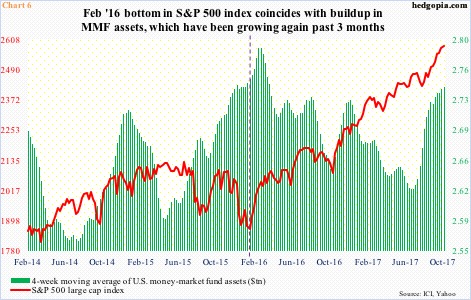
This love for stocks is also reflected in ETF flows.
Beginning February 11, 2016 through last Thursday, as per ETF.com, three S&P 500-focused ETF’s – SPY (SPDR S&P 500 ETF), VOO (Vanguard S&P 500 ETF) and IVV (iShares core S&P 500 ETF) took in $61.3 billion. Another $3.7 billion went into QQQ (PowerShares QQQ trust), and a combined $20 billion into IWM (iShares Russell 2000 ETF) and IJR (iShares core S&P small-cap ETF).
Concurrently, on a four-week rolling average basis, money-market fund assets had risen to $2.76 trillion when stocks bottomed in February 2016 (dashed line in Chart 6), and rose a little bit more before coming under sustained pressure. Mid-July this year, the green bars bottomed at $2.62 trillion, then rising to $2.74 trillion last week. It is hard to quantify the sources behind this recent buildup. Flows into stocks are still healthy.
Nonetheless, equity bulls must be hoping at least some of these money-market funds makes its way into stocks. In this scenario, stocks get another tailwind, and hopefully for the bulls, leads to another short squeeze.
Barring that, sources of tailwind are not as potent as the phrase ‘hated bull market’ would suggest exist.
Thanks for reading!
