
Several leading stocks such as MSFT and AAPL posted new highs last week and then reversed lower. This took place just ahead of 2Q earnings results and indices such as the Nasdaq 100 and the S&P 500 have had massive rallies, driving several indicators, including sentiment, into severely overweight territory.
Microsoft (MSFT) is one of the two largest weights in the Nasdaq 100 or the S&P 500. The other is Apple (AAPL). In QQQ (Invesco QQQ Trust), MSFT accounts for 12.9 percent and AAPL 12.3 percent. In SPY (SPDR S&P 500 ETF), they have been assigned weights of 6.8 percent and 7.5 percent respectively. The weightage is large enough to meaningfully influence these ETFs, and several others.
AAPL is $3 trillion in market cap and MSFT $2.6 trillion.
MSFT reports its June-quarter results on Tuesday, while AAPL is on tap for next week on August 3. Ahead of this, both rose to a new high last week but only to then reverse hard lower. They have had a phenomenal rally this year, or from last October’s low.
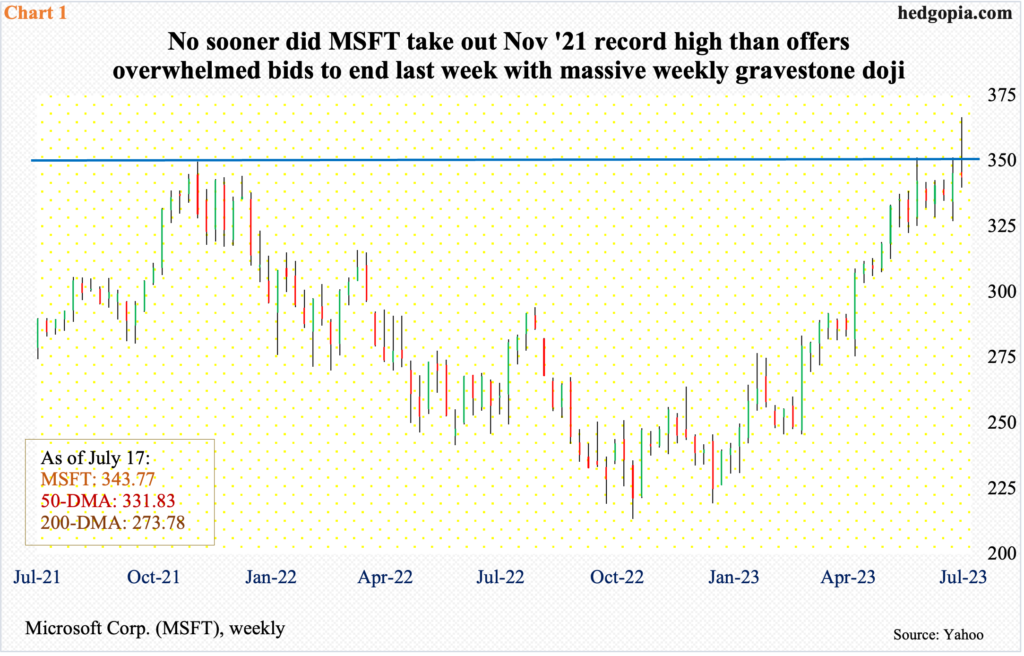
Through Tuesday’s fresh record high $366.78, MSFT, which then reversed to close the week lower 0.4 percent to $343.77, was up 52.9 percent; from last November’s low, it surged 71.9 percent. The intra-week reversal has helped form an ugly looking gravestone doji on the weekly (Chart 1). The stock has been denied a breakout.
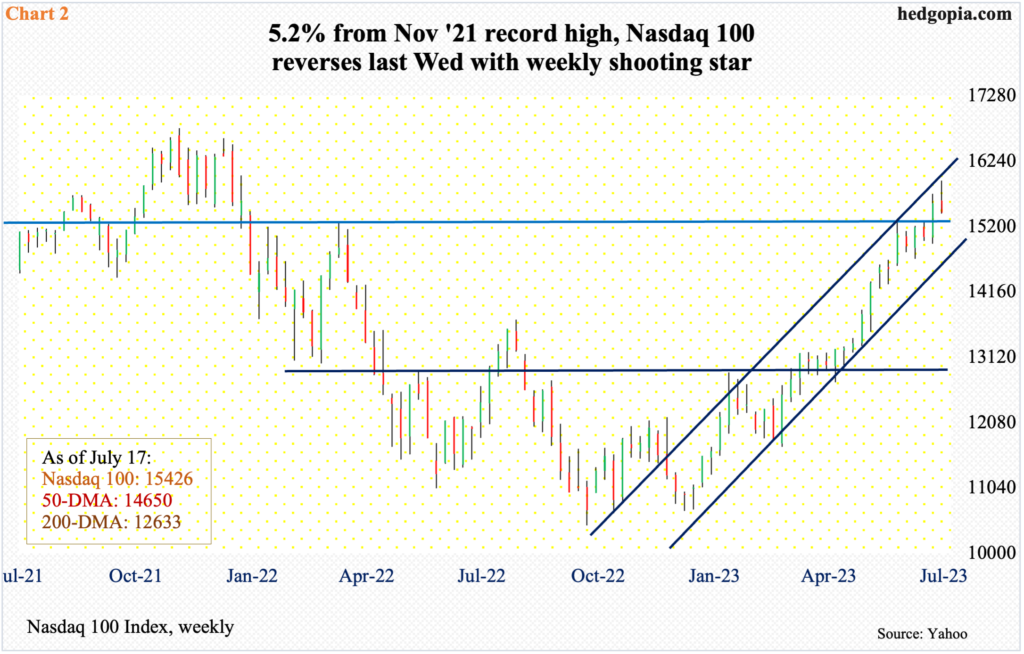
Not surprisingly, the Nasdaq 100 had a similar experience, printing a weekly shooting star on channel resistance (Chart 2).
On Wednesday, the tech-heavy index ticked 15932 but only to end the week at 15426, down 0.9 percent for the week. With six sessions of trading left, July is at risk of a monthly candle with a very long upper wick. This would have come after a rip-roaring 52.6-percent surge from last October’s low.
At last week’s high, the Nasdaq 100 was 5.2 percent from its record high posted in November 2021. At least for now, that high stays. The fact that money is leaving just ahead of earnings reports from the leading weights should concern tech bulls.
The Nasdaq 100 suffered last week on the back of negative post-earnings reaction to 2Q results from Tesla (TSLA) and Netflix (NFLX), which had rallied strongly this year. Google owner Alphabet (GOOG) also reports on Tuesday and Facebook owner Meta Platforms (META) on Wednesday. Besides AAPL, Amazon (AMZN) reports on August 3. If the reaction doled out to TSLA and NFLX is a sign of things to come, the next couple of weeks can be tough for the bulls.
Immediately ahead, there is short-term support at 15280s on the Nasdaq 100.
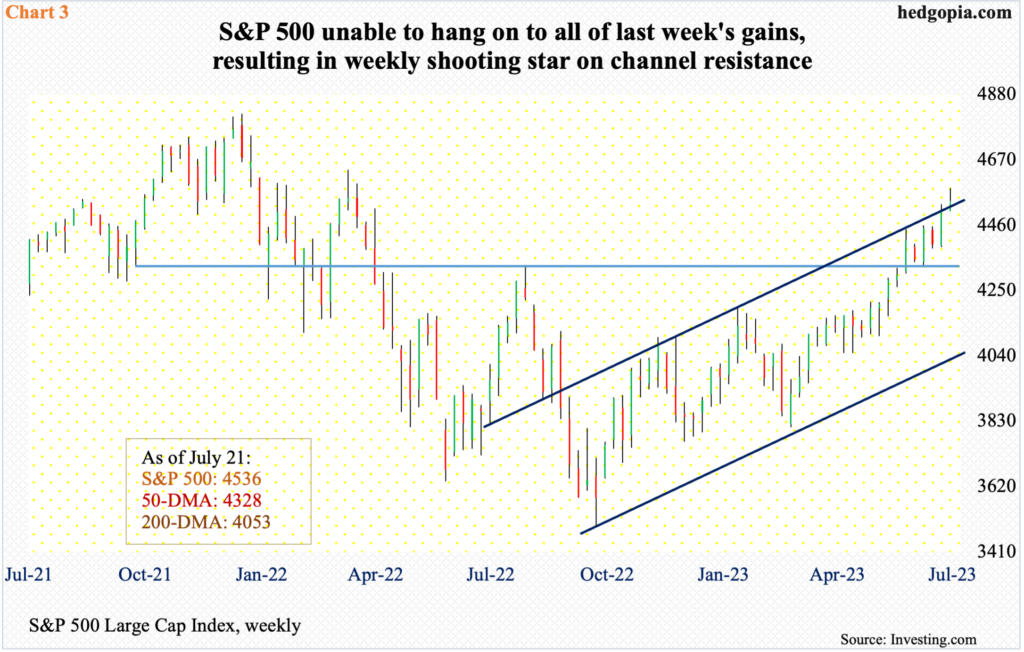
On the S&P 500, there is short-term support at 4450s. Last week, the large cap index rose 0.7 percent to 4536. At Wednesday’s intraday high 4578, it was up 1.6 percent for the week, but only to aggressively attracting offers. The weakness appeared at the upper trendline of an ascending channel from last October’s low (Chart 3). From that low through Wednesday’s high, the S&P 500 rallied 31.1 percent. It ended last week essentially right on the trendline, or arguably, slightly past it. In fact, if Wednesday’s high held, the index would have broken out.
The S&P 500 is attempting to do that amidst severely overbought condition. Last Friday, 89 percent of S&P 500 stocks intraday were above the 50-day; historically, this metric has tended to peak in the low-90s.
Should 4450s give way – likely – support at 4320s, which the S&P 500 broke out of on June 12, followed by a successful retest on June 26, is crucial. It is a make-or-break for the bulls. Their willingness to take on leverage, and to take on risk, will be tested.
In June, the S&P 500 rallied 6.5 percent. FINRA margin debt was fully on board, adding $37.1 billion last month to $681.2 billion – a 10-month high. Since last December, margin debt has gone up $74.6 billion.
The S&P 500 bottomed last October after dropping 27.5 percent from its January 2022 high, even as both the Nasdaq 100 and the Russell 2000 peaked in November 2021. The December 2022 low of $606.7 billion in margin debt declined 35.2 percent from the October 2021 record high $935.9 billion.
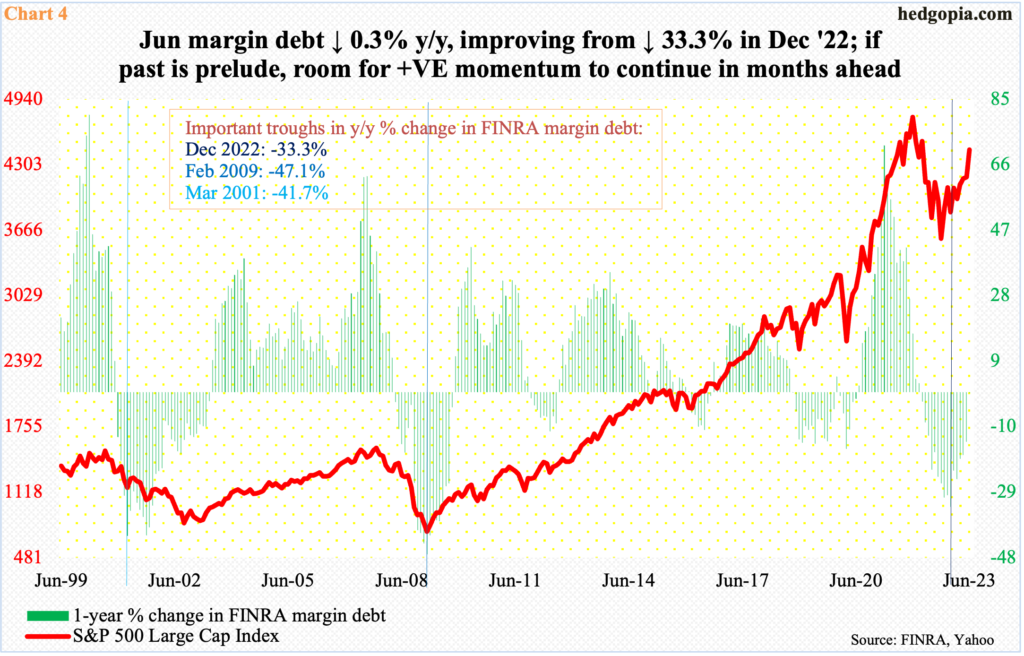
Through December, margin debt dropped 33.3 percent from a year ago. In June, the year-over-year drop shrank to 0.3 percent – essentially unchanged. In March 2001 and February 2009, margin debt tumbled 42 percent and 47 percent y/y before going the other direction; importantly, once the momentum shifted, the y/y pace kept rising well into positive territory (Chart 4). Equity bulls hope this phenomenon repeats itself this time around.
Bulls’ problem remains – once again – the overbought condition the major equity indices are in, not to mention elevated bullish sentiment.
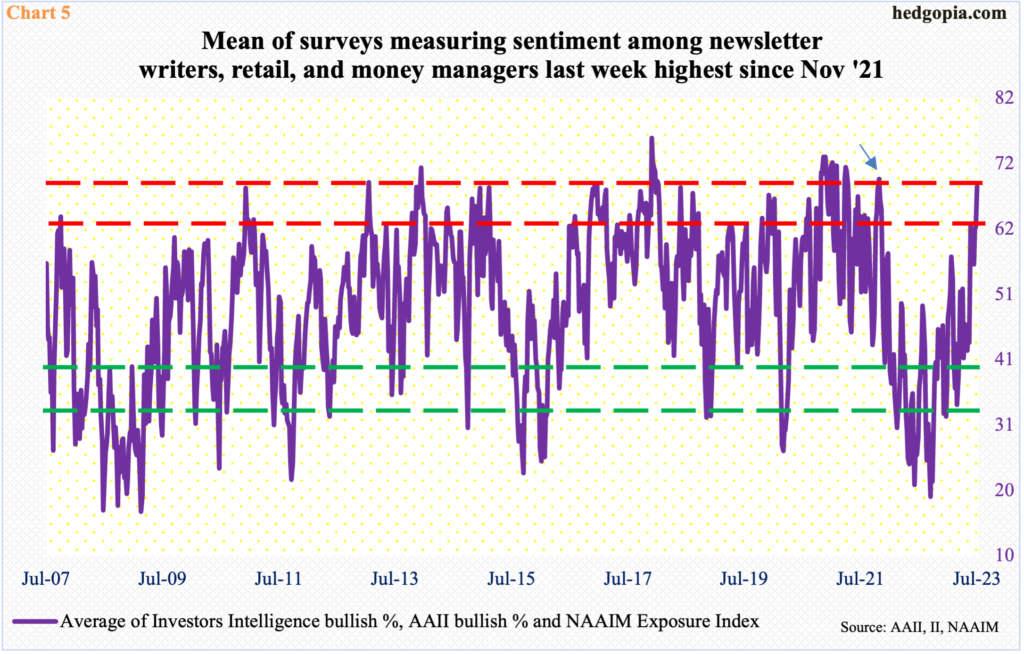
In Chart 5, an average of Investors Intelligence bullish percent, AAII bullish percent and the NAAIM Exposure Index is calculated; last week, it rose to the highest since November 2021.
The three surveys respectively measure sentiment among newsletter writers, retail, and money managers.
In the week to last Tuesday, Investors Intelligence bulls were 54.2 percent, up 2.8 percentage points week-over-week. In the week to Thursday, American Association of Individual Investor bulls were 51.4 percent, up 10.4 percentage points w/w, and in the week to Wednesday the National Association of Active Investment Managers rose 5.7 points w/w to 99.1. The result was an average 68.2. In the second week of November, the metric hit 69.4 and headed south (arrow in Chart 5).
In other words, sentiment is effusive – already. For reference, in the last week of September last year, the average was 19.3, which was the lowest since March 2009, and this laid the foundation in the equity rally that followed. Things are at the other extreme now. This is what the bulls will have to grapple with in the months to come.
Thanks for reading!
