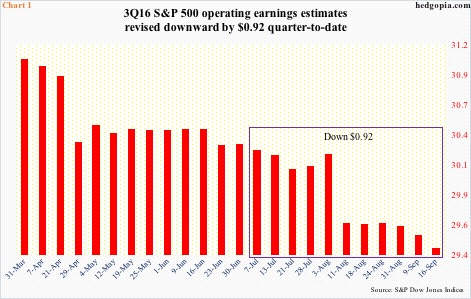
The 3Q16 earnings season is upon us … will begin in earnest in about three weeks. As of September 16th, S&P 500 companies are expected to earn $29.41 out of operations (courtesy of S&P Dow Jones Indices). This compares with $25.70 quarter-over-quarter and $25.44 year-over-year.
Going by how revision trend evolved in the last several quarters, 3Q16 estimates are likely to drop in the remaining eight sessions. Since the quarter started, estimates have already been chopped by $0.92, as at the end of June, 3Q16 was expected to bring in $30.33 (Chart 1). In fact, these estimates were as high as $34.61 at the end of 1Q15 (not shown in the chart)!
For the last several quarters – even years – downward revision has become a rule, rather than an exception.
If past is guide, 3Q16 estimates run a risk of downward revision not only during the remainder of the quarter but well into the earnings season. At least that is how things unfolded going back several quarters.
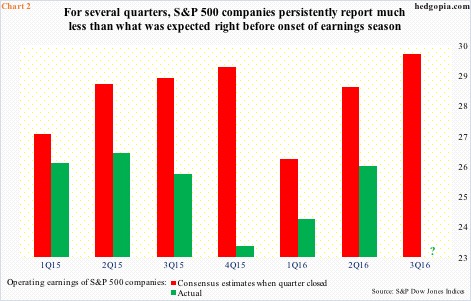
Chart 2 compares consensus estimates at the time a quarter was coming to an end with what was actually earned. The difference between the two could not be starker. At least going back six quarters to 1Q15, actual operating earnings persistently fell short of consensus – at times substantially. For instance, 4Q15, as the quarter was closing, was expected to bring in $29, and three months later, we find out actual earnings were $23.06.
To reiterate, Chart 2 highlights the difference between what was expected and what was earned once a quarter closes – in other words, the amount by which the bar keeps getting lowered once companies have already begun reporting. This acts as mini-tailwind for stocks.
Table 1 highlights this. In the six quarters mentioned above, actual operating earnings lagged consensus estimates in all six – ranging from -3.6 percent in 1Q15 to -20.5 percent in 4Q15. And in five of them, once a quarter closed and companies began reporting, the S&P 500 was higher one month later.
What might 3Q16 bring?
As stated earlier, if 3Q16 follows the recent trend, the downward revision trend is likely to continue well into October, which potentially helps stocks. If stocks instead diverge and cannot rally on this, then it might just be a sign that there has been a shift in investor/trader sentiment, which can be blamed on a whole host of things including recent sluggish action in stocks, the way bonds have been behaving and/or rising multiples.
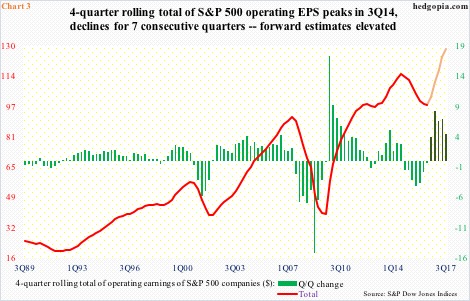
Speaking of which, the Street uses forward multiples. The S&P 500 currently trades at 21.4 times using trailing 12 months (to 2Q16) and 16.7x using forward estimates. Why the huge difference?
The 16.7 multiple uses estimates for 4Q16 ($31.21), 1Q17 ($30.52), 2Q17 ($32.61), and 3Q17 ($33.83). Evidently, these are lofty estimates. In the middle of January this year, 2017 estimates started out at $141.11, which has now been cut down to $132.44, but remains elevated versus the current 2016 estimate of $110.28. Incidentally, 2016 in 4Q14 was estimated to bring in $137.50. Along the same lines, 2015 estimates in 2Q14 were $137.50; when it was all said and done, 2015 earned $100.45, down from $113.02 in 2014.
Investor focus is not on the persistent downward revision of earnings, rather on multiples that are keyed off of elevated forward estimates. Because estimates start out very optimistic, forward estimates are lower than they would otherwise be. Then as these estimates get lowered, companies get to beat them. It has been a typical ‘heads I win, tails you lose’ scenario.
Hence the significance of 3Q16 earnings season. Divergence from the recent quarterly trend can be a big tell.
Thanks for reading!

