
- Small-caps relative outperformer past several weeks
- Hard to make fundamental case, but technically RUT acts very well
- Ideal, and probable, scenario: RUT pulls back for successful retest of recent breakout
There is something very interesting going on in the small-cap world.
As the year began, there was a lot of chatter around how this is the year for small-caps to shine. These stocks pretty much went sideways last year, digesting the gains made in 2013 (Chart 1). Although other indices, including the S&P 500 large cap index and the Nasdaq composite, too, had nice gains in 2013 but they did not feel the need to take a breather.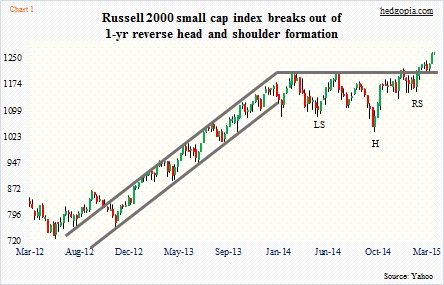
Nonetheless, small-cap bulls argue that the sideways action last year is nothing but a continuation pattern and that it is just a matter of time before another leg higher gets underway. Indeed, in December last year, the Russell 2000 small cap index (1264.71) broke out, albeit falsely, it turns out. Early February, it broke out again – this time successfully.
The bullish theme seems to be panning out. Not sure if it is self-fulfilling prophecy that is at work here or something else going on.
The fundamental case is lacking, come to think of it.
Bulls bring up macro underpinnings to support their thesis. Which goes something like this. Economies overseas are weak and getting weaker. The U.S. economy is holding up fine and is expected to strengthen. As a result, multinationals suffer, but domestically focused small-caps should prosper.
However, most economic data points the past several weeks have disappointed. Post-FOMC last week, markets have pushed back rate-hike expectations this year.
But the chart does not agree and is giving us a different message.
Not only has the Russell 2000 broken out of its one-year range, but in the process has traced out a pattern that technicians believe to be highly reliable – the reverse head-and-shoulder formation (Chart 1). The neckline lies around 1210, which was successfully tested two weeks ago. The only knock is that when the breakout occurred, volume (on IWM) failed to spike, which is preferable in order to confirm the validity of the move. Nonetheless a technician can come up with a measured move target of 1,380. That is nearly nine percent from here!
For this to come to pass, equities need to soon enter a melt-up phase.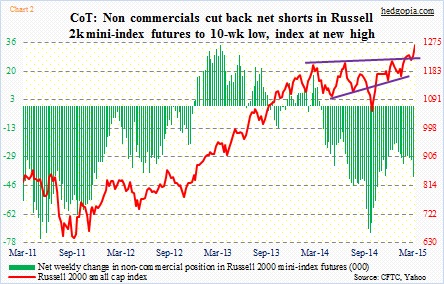
In the futures market, non-commercials are skeptic. They continue to remain net short Russell 2000 mini-index futures, even though they did cut them back to a 10-week low in the most recent period (Chart 2).
Here are a few potential roadblocks.
First, the volatility index for the Russell 2000 remains suppressed (Chart 3). This data series only goes back to 2006, but in the past has consistently troughed in the 14-15 range. It closed yesterday at 15.24, up 0.24.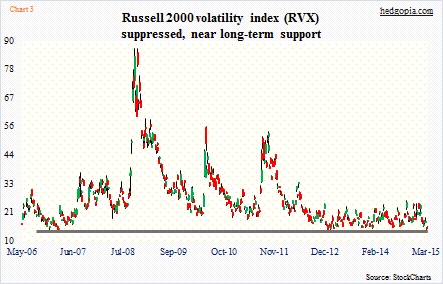
Second, biotechs have been on a tear. Parabolic. Unsustainable. Choose your adjectives. ETFs such as IBB and XBI are giving off signs of at least a near-term peak. In the Russell 2000, health care has the second-most weight, behind financial services, and ahead of technology, consumer discretionary, and producer durables. Among the top 10 holdings, three are health care-related – ISIS, PUMA and DXCM.
And third, if the dollar comes in here – which is looking probable – it will be interesting if that ends up helping large caps, at least on a relative basis. The ratio of Russell 2000 to S&P 500 has been rising since it made a trough last October (Chart 4), a reversal of which can hurt small-caps.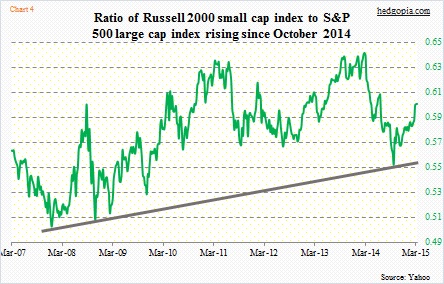
Put it all together, a case can be made that small-caps are in for some pressure in the near term. Ideally, a successful test of that neckline (Chart 1) will be very healthy. That is four percent away.
