
Since the U.S. presidential election through the intra-day high last Thursday, 10-year T-yields jumped 63 basis points, and two-year yields 27 basis points. From the July 6 all-time low of 1.34 percent, 10-year yields surged 115 basis points.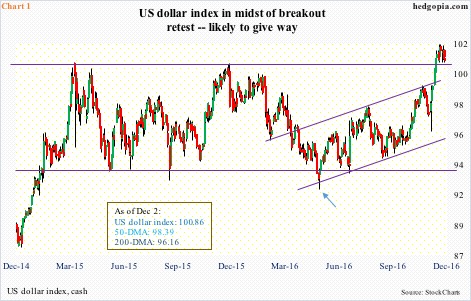
Riding on rates’ coattails post-election through November 25, the US dollar index rallied 4.2 percent. Since the May bottom this year, it rallied nearly 11 percent – a big move for seven months’ work (arrow in Chart 1).
Since that May low, the dollar index (100.86) traded within an ascending channel, until it broke out last month, followed by another breakout soon thereafter. On November 17, it broke out of resistance going back to March last year when it peaked at 100.71. Since that breakout, retest has taken place several times – so far successfully.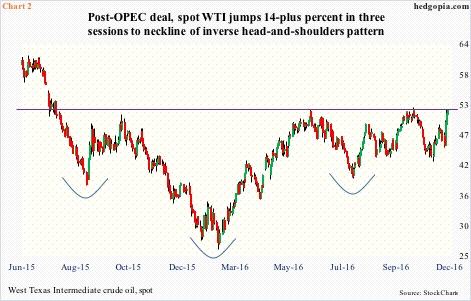
Crude oil similarly sits at a crucial juncture.
Last week, OPEC surprised markets by hammering out a deal to cut production by 1.2 million barrels per day by January. This was the first cut in eight years, and is good for six months. Even Russia, a non-OPEC member, will pitch in with a cut of as much as 300,000 b/d.
West Texas Intermediate crude surged 9.3 percent on Wednesday, adding another 4.6 percent in the next two sessions. XLE, the SPDR energy ETF, rallied 2.9 percent last week. On Wednesday, U.S. shale plays Continental Resources (CLR) jumped 23 percent and Whiting Petroleum 30 percent, among others.
With last week’s rally, spot WTI ($51.68) is sitting right under the neckline of an inverse head-and-shoulders pattern (Chart 2). A convincing breakout here will have massive repercussions for oil – at least technically. Do the bulls have fuel left in the tank? Volume last week was the highest ever.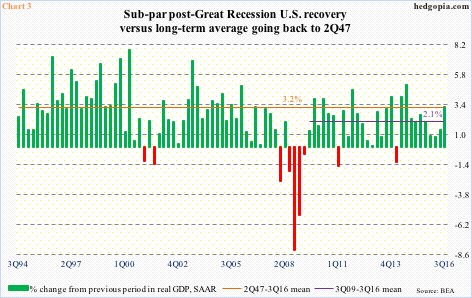
In a larger scheme of things, higher interest rates, stronger dollar, and higher oil price probably does more harm than good. Particularly when the economy is already sub-par.
Chart 3 plots annualized sequential growth in real GDP. The U.S. economy grew 3.2 percent last quarter. This was the best growth rate in two years, and comes in the wake of anemic performance in the prior three quarters.
In fact, since Great Recession ended, growth has substantially lagged – an average 2.1 percent versus the 2Q47-3Q16 average of 3.2 percent.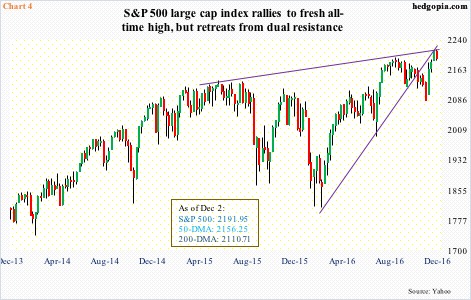
Thus far, equities have embraced the trio of higher rates, stronger dollar and higher oil price with open arms.
President-elect Donald Trump’s emphasis on lower taxes, infrastructure spending and less regulations have revived growth hopes. Inflation expectations have inched up. Post-election through last Wednesday’s all-time high of 2214.1, the S&P 500 large cap index rallied 3.5 percent (Chart 4).
In the four sessions through November 11, SPY, the SPDR S&P 500 ETF, attracted $14.5 billion. There have been withdrawals recently, but through last Thursday, inflows were still $10.7 billion (courtesy of ETF.com).
Here is the thing.
The recent uptick in interest rates, the dollar and oil in all probability ends up adversely impacting economic activity. Perhaps XLY, the SPDR consumer discretionary ETF, is beginning to reflect this concern, peaking on November 25, three sessions prior to the S&P 500. The ETF was also unable to save a three-and-a-half-month breakout.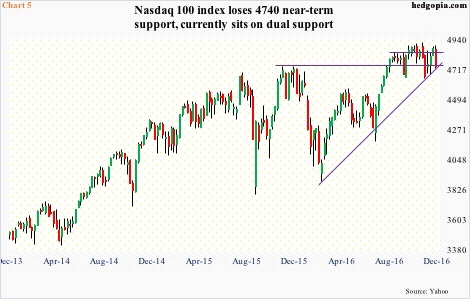
Hence the question – how long before stocks in general begin to reflect this? Information technology – as important a sector as it is, with a 20-percent-plus weight in the S&P 500 – is already not sending good vibes.
If we assume the Trump win has set in motion a risk-on attitude among investors/traders, this is definitely not reflected in tech stocks. The Nasdaq 100 index did not even post a new high. The October 25 peak of 4911.76 stands, with relative weakness. It currently sits on make-or-break dual support – a rising trend line from February this year and horizontal support going back to November last year (Chart 5).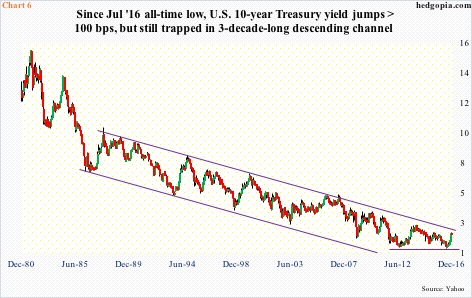
If growth and inflation expectations do come through, that should light another fire under the greenback. Ditto with crude oil. Which means the recent breakout on the dollar index stays intact and spot WTI breaks out of the neckline mentioned above.
In this scenario, the 10-year T-yield breaks out of the three-decade descending channel it is in, thus ending the awfully long bull market in bonds (Chart 6).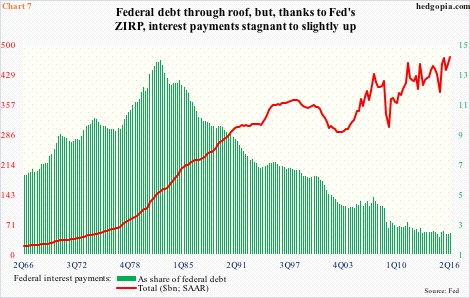
The problem with this scenario is leverage.
Just on the federal level, the government owes $19.9 trillion in debt ($19.4 trillion as of 2Q16 in Chart 7). In 2Q16, federal interest payments were $471.7 billion (seasonally adjusted annual rate) – nearly on par with $456.6 billion inn 2Q11. Between the periods, debt went up by $5 trillion. But the drop in rates – 10-year yields from 3.2 percent to 1.5 percent, for instance – helped suppress interest payments.
If these yields break out and begin a new phase of higher rates, interest payments will go through the roof. This also applies to the state and local government ($3.1 trillion in debt), households ($14.5 trillion), and the corporate sector ($8.4 trillion). This in and of itself should act as automatic brakes on the dollar, and on economic growth.
That said, post-Trump win, the S&P 500 has priced in an opposite scenario – that of growth … a scenario in which the dollar index builds on the recent breakout, and both spot WTI and 10-year yields break out.
But the dollar index in particular is probably on the verge of losing breakout support, which should shake off the post-election optimism accorded stocks.
This would also have come at a time in which the S&P 500 in particular sits right under dual resistance – the underside of a rising, but broken, trend line from February this year and a slightly rising trend line from May last year – potential spot for trend reversal.
Thanks for reading!
