U.S. housing is stuck.
That is pretty much the impression one gets looking at April’s housing starts that were out yesterday.
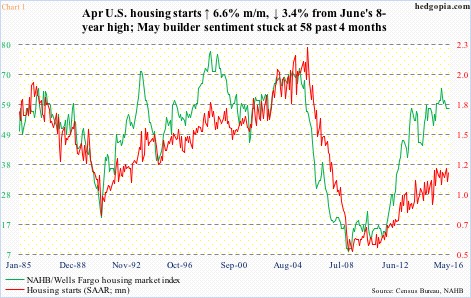
Starts rose 6.6 percent month-over-month to a seasonally adjusted annual rate of 1.17 million units. The cycle high 1.21 million units was reached in February, which was the highest since 1.26 million in October 2007.
Importantly, starts have been absolutely flat since last June – in line with flattish builder sentiment (Chart 1).
The NAHB/Wells Fargo housing market index remained unchanged at 58 in May, and has been stuck there the past four months. Barring a spike to 65 last October – a ten-year high – the index has been sideways since November-December 2014, when the reading was, you guessed it, 58.
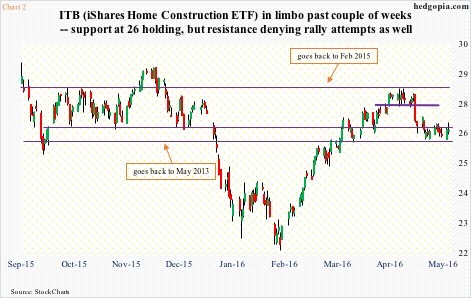
This sideways move in housing activity is reflected in how ITB, the iShares Dow Jones home construction ETF, has traded.
It has been range-bound between $26 and $28 for a while now, with support at $26 going back three years (Chart 2).
Off February 11th lows, ITB rallied 30 percent in nine weeks, then quickly shed seven percent. In the past couple of weeks, the $26 support has been tested several times, which has held. However, resistance is repelling rally attempts as well.
Yesterday, early strength was rejected at the 50-day moving average. Daily technicals are oversold, but weeklies are overbought, so it is a matter of which one wins out that will decide ITB’s near-term path.
Assuming $26 does not give way this week, shorts can deploy options to once again earn some premium.
To recall, hypothetically on April 20th, ITB ($26.39) was shorted at $27.66.
Then on May 10th, a short put was deployed, selling May 13th 26 puts for $0.20. If assigned, the position would get covered for a profit of $1.86. Unassigned, it would help raise the price it was shorted at to $27.86.
May 20th 26 puts bring $0.15 – not bad with three sessions remaining. If it is put, the position is unwound for a profit of $2.01. Else, the short price rises to $28.01.
Thanks for reading!

