U.S. small-caps are rallying. Rallying hard. Harder than several of their peers.
Since the intra-day low on February 11th, the Russell 2000 small cap index is up just north of 14 percent, also breaking out of 1035. This level approximates $103 on IWM, the iShares Russell 2000 ETF (Chart 1).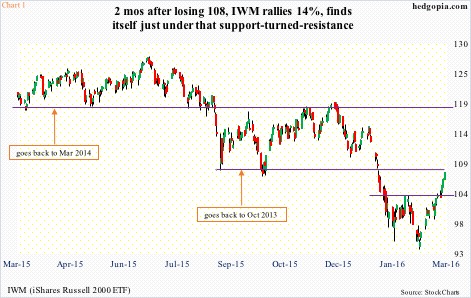
In comparison, the S&P 500 large cap index is up just north of 10 percent, the Nasdaq 100 index just north of 11 percent, the Dow Industrials north of nine percent, and the Dow Transports nearly 12 percent, among others.
What is the message here?
That risk-on is back? That the U.S. economy is on its way to shaking off nearly seven years of doldrums?
Other corners of the markets are not in agreement with this hypothesis.
XLP, the SPDR consumer staples ETF, and XLU, the SPDR utilities ETF, are trading near all-time highs. Both these are defensive in nature. In contrast, offensives such as XLY, the SPDR consumer discretionary ETF, and XLK, the SPDR technology ETF, are nowhere near their respective highs.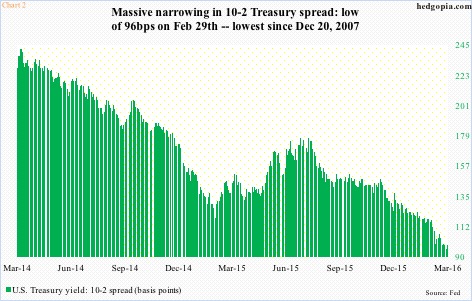
Small-caps inherently have more domestic exposure, and tend to do well if the economy does well. The bond market nonetheless continues to forecast subdued economic activity. The yield spread between 10- and two-year Treasury notes dropped to 96 basis points in the last two sessions of February before rising a tad. The late-February low marked the narrowest spread since December 20, 2007 (Chart 2).
So why are small-caps outperforming their peers? Because they got hit the most previously? It is possible.
The Russell 2000 first peaked as early as March 2014. It briefly broke out of that resistance in February 2015, before proceeding to making a new all-time high four months later. Then came the rout in August-September last year. The 1200-plus support was lost (120-ish on IWM). Come late November/early December, a healthy rally attempt failed at that resistance. From that high through the afore-mentioned low last month, it lost nearly 22 percent.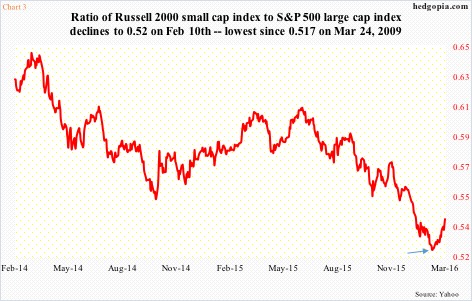
Such was the underperformance versus larger peers that the ratio of the Russell 2000 to the S&P 500 started dropping in late June last year and would only bottom last month. The February 10th low of 0.52 (arrow in Chart 3) was the lowest since 0.517 on March 24, 2009. Side note: this could potentially end up being an important low in the ratio. Time will tell.
For now, the beat-up sector is beginning to attract funds. Since February 23rd through Wednesday this week, $812 million moved into the ETF. That said, a lot more was redeemed during the sell-off. This year through the February 11th low (in the ETF), $1.2 billion was withdrawn. Even since the February 11th low through Wednesday this week, $738 million was redeemed (courtesy of ETF.com).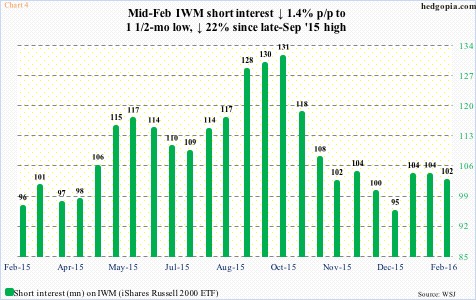
Besides, short interest on IWM is not as high as in late September (Chart 4) – when shorts massively got squeezed – but probably high enough to lend a helping hand to the ETF’s rally. The mini-breakout took place on March 1st (Chart 1), so the end-February period would not reflect this. But IWM already rallied nearly eight percent in the February 12-29 reporting period, probably resulting in some level of squeeze.
The key to watch is 108 on IWM ($107.13), and its fate – breakout or fake-out – will likely be decided in the futures market.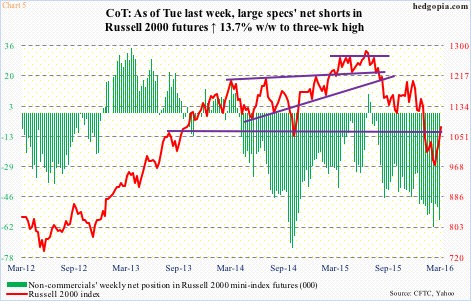
Non-commercials have doggedly remained net short Russell 2000 mini-index futures. The last time they were net long was in late June last year (Chart 5). They have been rewarded for their bearishness. As stated earlier, off late-December (2015) highs, the Russell 2000 lost north of 20 percent. But here is the thing.
By Tuesday (Feb 23rd) last week, the Russell 2000 was up 7.3 percent from the low seven sessions ago, and this had not yet convinced these traders to begin to cover. Since that Tuesday until Tuesday this week, the Russell 2000 rallied another 4.2 percent. The breakout took place this Tuesday, so this week’s holdings should give us a good read into how these traders reacted. Numbers will be out later today – worth watching.
Thanks for reading!

