
IWM, the iShares Russell 2000 ETF, broke out Thursday, and it is time to pay heed to that famous quote, “When the facts change, I change my mind. What do you do, sir?”
To refresh, back on May 26th, hypothetically a weekly June 5th 125/126.50 bear call spread was opened for a credit of $0.56 (short 125 for $0.91, long 126.50 for $0.35). Come expiration, IWM closed at $125.40. The short call got assigned, resulting in an effective short at $125.56.
Last Thursday, the ETF ($127.86) broke out.
It has potential to become an important breakout. It is up to the bulls if they can fully cash in on it.
Prior to the Thursday move, the ETF had gone sideways for three months – not able to crack open resistance at $126-$126.50. To rub salt to the wound, late April it lost the October 2014 trendline. Since that loss, it had been rising along the underside of that trendline. But the $126-$126.50 resistance held firm.
This gave way Thursday (Chart 1). Here is the thing, though. Once again, the ETF finds right underneath the broken trendline. More often than not, these trendlines, once broken, tend to stop rally attempts.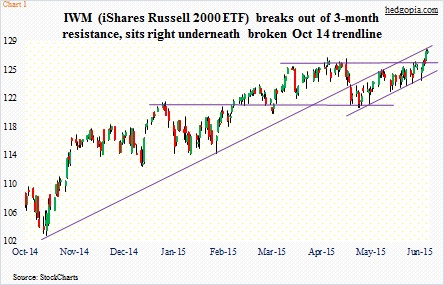
Here are three possible scenarios how trading could unfold in the coming days and weeks.
Scenario one: The underside of that broken trendline proves too strong. IWM retreats, but finds support at the broken resistance. A successful retest is always positive.
Scenario two: Last week’s momentum continues. The ETF goes on to break out of that broken trendline.
Scenario three: The ETF flames out, then dipping below the broken resistance. In which case, it will just be a false breakout.
The way it broke out last week, IWM deserves the benefit of the doubt for now. Kudos to bulls who kept hammering on that resistance for three long months. At the same time, by doing so they have expended lots of energy.
Shorts probably helped in the breakout. Short interest rose by 20 percent in the two months through May-end – from 97.3 million to 116.7 million. In the latest reporting period, short interest was the highest since end-November. A recipe for a squeeze.
Then there were non-commercials who by Tuesday had reduced net shorts in Russell 2000 mini-index futures to the lowest since April 2014 (Chart 2). This could not have hurt either.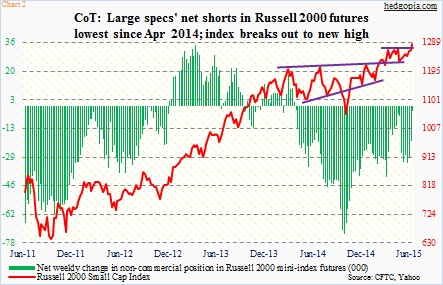
What now then?
Here are three possible ways we can play this.
One, cover and cut losses.
Two, deploy a short collar, combining a short put and a long call with the existing short. For instance, in the weekly June 26th expiration, 126.50 puts are selling for $0.65 and 128.50 calls for $0.59, netting a credit of $0.06. The strategy assumes possible near-term strength and medium- to long-term weakness in IWM. Should the ETF continue to rally this week, the long call, which is financed by the short put, will enable upside participation past $128.50. In the event the ETF breaks $126.50 to the downside, the short put will cancel out the short position, resulting in a loss of $0.88.
Three, stay short the underlying, but at the same time, try to reduce the effective cost. Once again, using June 26th weeklies, 126 puts are selling for $0.53. If IWM rallies or goes sideways this week, a short put ensures an effective short at $126.09 (up from previous $125.56). If it breaks 126, then the short position will be effectively covered at $125.47 – essentially flat.
IWM is way overbought on a daily basis, and will get there soon on a weekly chart. So odds favor it does not run away from here. In the present context, the number three option, in which 126 puts are sold, makes sense. Should the ETF retreat, that $126-$126.50 support probably does not give way at the very first try. In this scenario, the premium is kept, effectively raising the price it was shorted at.
Thanks for reading!
