
U.S. small-caps suddenly came to life last week, and shorts have a decision to make.
The Russell 2000 small cap index was up 3.3 percent last week (Chart 1), and IWM, the iShares Russell 2000 ETF, up 3.4 percent.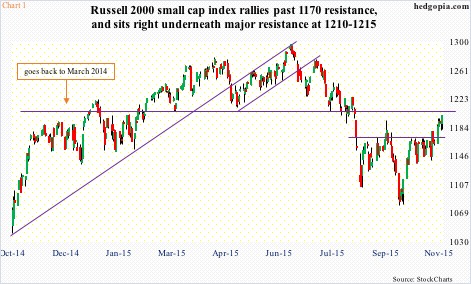
In contrast, the S&P 500 large cap index tacked on one percent, the Nasdaq 100 index 1.3 percent, and the Dow Industrials 1.4 percent.
Small-caps’ outperformance last week follows tentative action for several weeks after the September 29th low.
The S&P 500 large cap index, for instance, has rallied for six consecutive weeks. Ditto with both the Nasdaq 100 and the Dow Industrials. The Nasdaq 100, as a matter of fact, is at a new all-time high.
Both small- and mid-caps have lagged during this period. Even last week, the S&P 400 mid cap index only managed to rally 1.3 percent, keeping up with its larger brethren but lagging behind small-caps’ advance.
Before last week’s advance, the Russell 2000 was struggling to get past resistance at 1170. There was a breakout eight sessions ago, but fell back under it the very next session. That changed on Monday last week. A breakout was followed by additional gains, particularly on Friday.
The price action has improved, and the index is a stone’s throw away from testing 1210-1215. This has proven to be an important price point going back to March last year. The resistance also approximates the 200-day moving average (1215.89).
Can the momentum continue? Yes, if weekly conditions prevail over the daily ones. There is room to rally on a weekly chart, but daily momentum indicators are now overbought. Ditto with IWM. With one difference.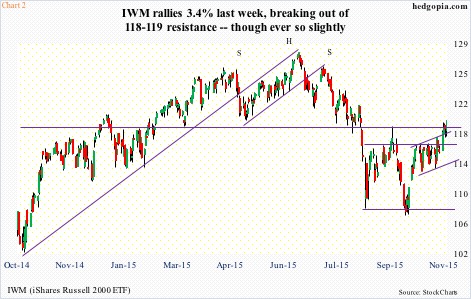
The ETF (119.22) has already taken out resistance at 118-119, though not by much (Chart 2). It is important to point out that the corresponding resistance on the Russell 2000 is intact.
IWM’s 200-day moving average lies at 120.17, a mere 0.8 percent away. If bulls are able to push it through that resistance, then that potentially can have repercussions for Chart 3.
Non-commercials were net short 41,690 contracts in Russell 2000 mini-index futures as of Tuesday last week, and have doggedly stayed bearish since the September 29th low. Back then, they were net short 28,955 contracts. If they are convinced that last week’s action has legs and proceed to reverse their bearish bets, then odds grow IWM’s weekly conditions prevail.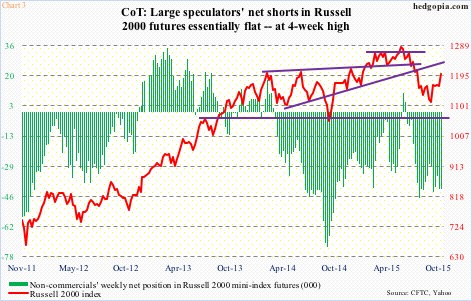
Otherwise, the overhead resistance on the Russell 2000 as well as its 200-DMA can be a factor near-term.
Nonetheless, bulls have now secured themselves decent support levels for them to step into – the 1170 region and 50-DMA (1152.44). The latter has turned up. The corresponding levels on IWM are 116-plus, and 114.37.
Now enter last week’s hypothetical trade, in which weekly November 6th 116.50 calls were sold for $0.57, resulting in an effective short at $117.07. When IWM was stagnant, selling upside calls proved to be a good strategy for income generation. Last week’s was the same idea. But the price action has improved.
Odds favor the ETF at least tests support at 116 before it is able to rally past 200-DMA, if at all. With this in mind, November 13th 117.5 puts fetch $0.41. If put, the short position gets covered for a loss of 0.02. Else, the short price rises to 117.48.
Thanks for reading!
