
January barometer, if comes to pass, bodes well for this year. The S&P 500 is up nearly 16 percent from the December 26 low. It is deeply overbought. Once unwinding begins, bulls hope bids show up at resistance-turned-support at 2600-2630. Although flows leave much to be desired.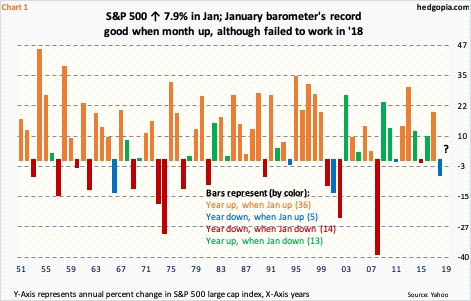
The verdict is in. The so-called January barometer, which posits that how January fares sets the tone for the year, bodes well for the rest of the year. At least equity bulls hope so. The S&P 500 large cap index jumped 7.9 percent in the opening month. Of course, there is no guarantee that the phenomenon will come to pass. It did not last year. Last year, January was up 5.6 percent, but the year ended down 6.2 percent. That said, its track record is pretty good.
Chart 1 looks at the S&P 500 annual returns going all the way back to 1951, with an apparent question mark for 2019.
The data is divided into four buckets: (1) years that were up when January was up, (2) years that were down when January was up, (3) years that were down when January was down, (4) years that were up when January was down. In parenthesis is the number of years for each bucket.
Of the 68 years covered, the barometer came to pass in 50. Orange bars simply jump out in the chart. They represent the years in which the S&P 500 was up for the year after a positive January. The blue ones correspond to the ones in which the year ended in the red even though January was up. Since 1951, this has only occurred five times; plus, the S&P 500 has not dropped in two successive years after a positive January. In this respect, bulls have history on their side, but you never know.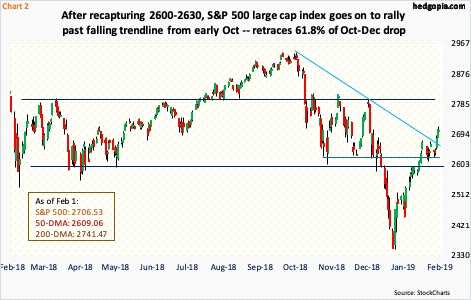
This much we know.
Not only did the S&P 500 get out of the blocks really strong in January but it already rallied just under 16 percent since the low on Boxing Day. In so doing, bulls have managed to repair quite a bit of the damage suffered during the three-month decline that began early October.
For nearly all of last year, the index remained trapped in a rectangle between 2800 and 2600. The lower bound was lost mid-December, which quickly led to acceleration in selling (Chart 2). Since bottoming on December 26, the S&P 500 has had quite a rally. Resistance at 2600-2630 has been broken. This was followed last week by recapturing of a falling trend line from early October.
Not surprisingly, the daily is deeply overbought. Last Friday’s intraday high of 2716.66 just about kissed the daily upper Bollinger band. More importantly, the S&P 500 just retraced 61.8-percent of the decline between October 3 and December 26. Fibonacci followers pay close attention to this – also known as the golden ratio.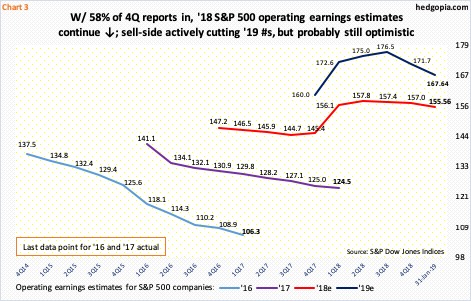
Last week, stocks got a further boost from the Fed, as it pauses in its tightening cycle. Ditto with earnings. As of January 31, nearly 58 percent of S&P 500 companies have reported their 4Q. On a blended basis, operating earnings were $38.99. When the quarter ended a month ago, they were expected to earn $40.42. At the beginning of 4Q four months ago, these estimates were $42.14. The point is, the sell-side was busy lowering the bar. Oddly, this has continued well into the reporting season.
The downward-revision trend is not just limited to 4Q. Estimates for this year currently stand at $155.56, versus $156.99 a month ago when the quarter ended. Similarly, 2019 estimates are now $167.64, nearly $10 lower from the high early August last year of $177.13 (Chart 3). Even now, the expected growth rate this year of 7.8 percent is probably too optimistic. This is a fact that equity bulls have to constantly wrestle with as the year progresses, particularly so as the S&P 500 has rallied just short of 400 points from the late-December low, putting upward pressure on multiples.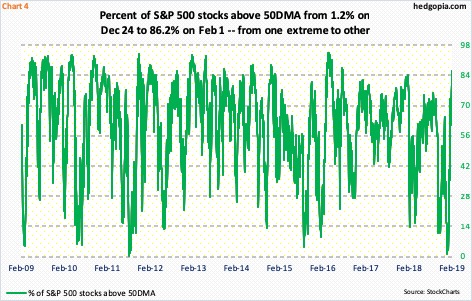
Several other metrics have quickly gone from one extreme to the other.
On Christmas Eve, merely 1.2 percent of S&P 500 stocks were above their 50-day moving average, which was the lowest since August 2011. Twenty-six sessions later (from last December’s low), 86.2 percent of these stocks were above the average – the highest since July 2016 (Chart 4).
This gets unwound. Sooner or later – just a matter of when, not if. The question, once again, is when that happens, would there be bids waiting to defend 2600-2630? Thus far, bulls probably are not that encouraged by the trend in flows.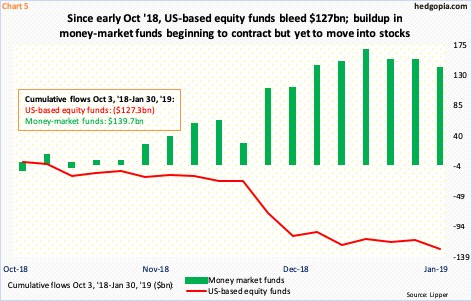
Chart 5 calculates flows in and out of US-based equity funds and money-market funds beginning October 3 when the S&P 500, and other major indices, began what soon turned out to be a waterfall dive.
In the week ended Wednesday, $13.6 billion left equity funds, for total redemptions of $127.3 billion since early October. In the same week, $12.8 billion came out of money-market funds. In fact, the latter have contracted in the past three weeks, but they are yet to earnestly move into equities.
Elsewhere, as ETF.com points out, “US stocks had their best January performance since 1987, but ETF investors didn’t chase the rally. When all was said and done, they pulled $2.2 billion from US-listed ETFs, the first January outflow since 2015.”
The point in all this is that unless flows improve – soon – those who doubt the sustainability of this rally will be proven right – particularly so considering how overbought conditions are. Bulls do not want a repeat of last year when January barometer failed to live up to its expectations.
Thanks for reading!
