
A day before Wednesday’s mini-collapse in major US stock indices, Investors Intelligence bulls reached a multi-week high. Some of these indices are near important support, providing bulls an opportunity to regroup. Longer-term, sentiment remains elevated.
Equities took it on the chin Wednesday. The Dow Industrials gave back 3.4 percent, the S&P 500 3.5 percent and the Nasdaq 100 3.9 percent. The latest selloff began after they posted a lower high on the 12th this month versus their September 2nd high.
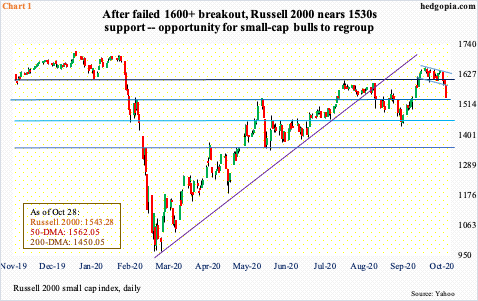
The Russell 2000 was an exception in this in that the small cap index made a higher high on the 12th. The intraday high of 1652.05 in that session was the highest since October 24th. By then, the index had broken out of 1600-plus, which has been an important price point for both bulls and bears since January 2018. But the breakout proved temporary.
Monday’s breakout retest was unsuccessful, followed by back-to-back selling. On Wednesday, all these four indices produced a marubozu candle. Selling was intense. Concurrently, small-cap bulls have an opportunity to regroup as the index (1543.28) is just above horizontal support at 1530s, although the 50-day (1562.05) has been breached (Chart 1).
Regardless what happens near term, investor sentiment remains effusive – at least measured by Investors Intelligence.
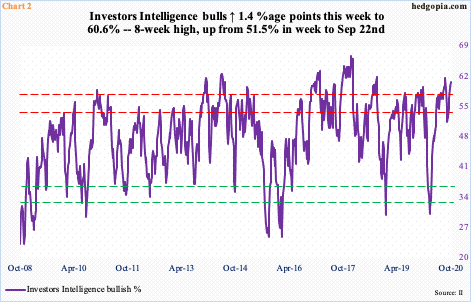
This week, bulls were up 1.4 percentage points week-over-week to 60.6 percent, while bears fell two-tenths of a percentage point to 20.2 percent. Bulls’ count is at an eight-week high. Back then, in the week to September 1, bulls were 61.5 percent and bears 16.4 percent. The drop since bottomed three weeks later at 51.5 percent. The S&P 500 peaked on September 2nd and bottomed on the 24th. This time around, the large cap index peaked well ahead of a peak in sentiment.
It will be interesting what next week brings as to if Wednesday’s selling ends up impacting sentiment. What we do know is that it is hard to sustain above 60s (Chart 2). Besides, from a longer-term perspective, sentiment remains elevated.
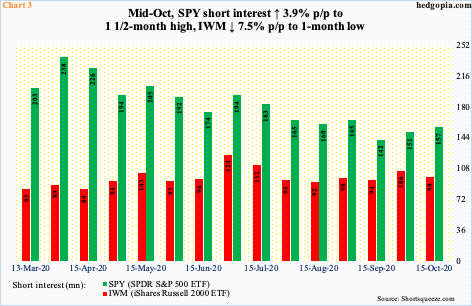
The other thing is that shorts were not very aggressive leading up to this selloff. Mid-Oct, short interest on SPY (SPDR S&P 500 ETF) rose 3.9 percent period-over-period to a one-and-a-half-month high, while IWM’s (iShares Russell 2000 ETF) dropped 7.5 percent to a one-month low (Chart 3).
That said, it is worth pointing out that short-interest data come out twice a month. The latest data is as of nine sessions ago, so is outdated come to think of it. At the time, SPY was still above its 50-day, which was only breached on Monday (this week); IWM’s was not lost until Wednesday. So, it is entirely possible that SPY shorts got aggressive after the average was breached this week, which will only be captured in the current report.
If past is prelude, as short interest gets accumulated, it can act as a tailwind after selling ends and as shorts cover. At least as of mid-Oct, shorts have not been overly aggressive.
Thanks for reading!
