
Large- and small-caps are diverging, with the former looking to break out to a fresh high and the latter stuck in a range well off its high.

Large-cap bulls are eying a breakout on the S&P 500. Last week, the large cap index rallied 1.5 percent to 6115, with an intraday high of 6127 on Friday, which was less than a point from the all-time high of 6128 posted on the 24th last month (Chart 1).
This is an opportunity for the bulls to fashion a breakout. Last week’s action comes after they failed to hang on to the gains of the prior week. Bids showed up last Tuesday at the 50-day (6008); the average has not been lost on a closing basis in the past month.
For a breakout to occur, horizontal support at 6100 needs to be defended. In this scenario, a breakout would have taken place at a time when the daily Bollinger bands have narrowed; this often precedes a sharp move up or down.
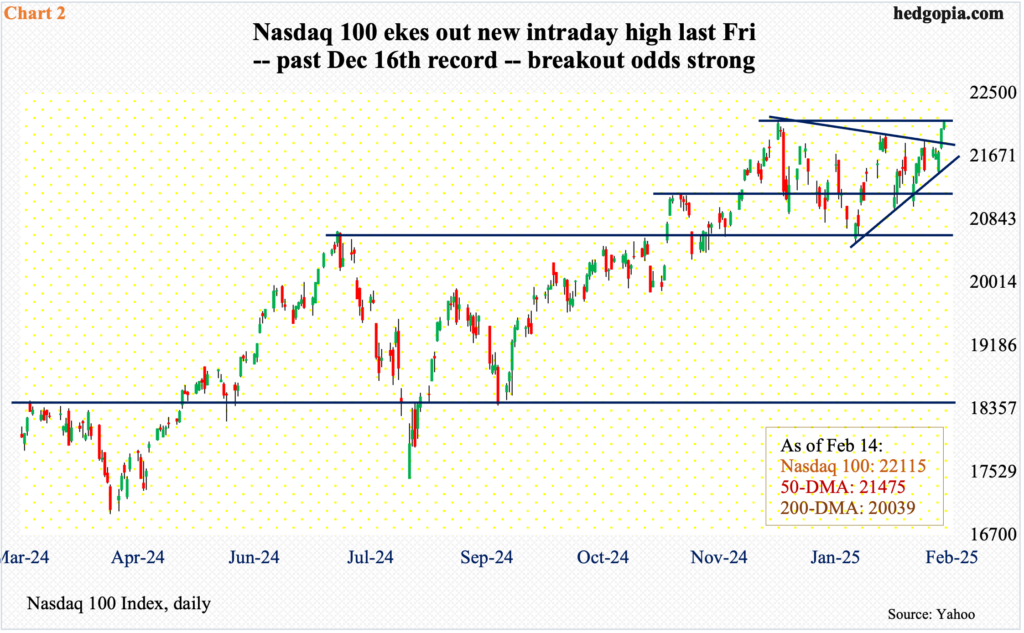
The Nasdaq 100, made up of the 100 largest non-financial companies, similarly sits at a crucial juncture.
The tech-heavy index recorded a fresh high of 22133 on December 16, before dropping 7.2 percent to 20538 by the 13th last month. The rally that followed stopped just under 22000 several times particularly last month; all along, bids were showing up at higher lows. Then came last Wednesday when the intraday kiss of the 50-day was aggressively bought, followed by more buys in the next two sessions. Friday, the index ticked 22139, closing out the week up 2.9 percent to 22115 (Chart 2).
When it was all said and done, a breakout looks imminent.
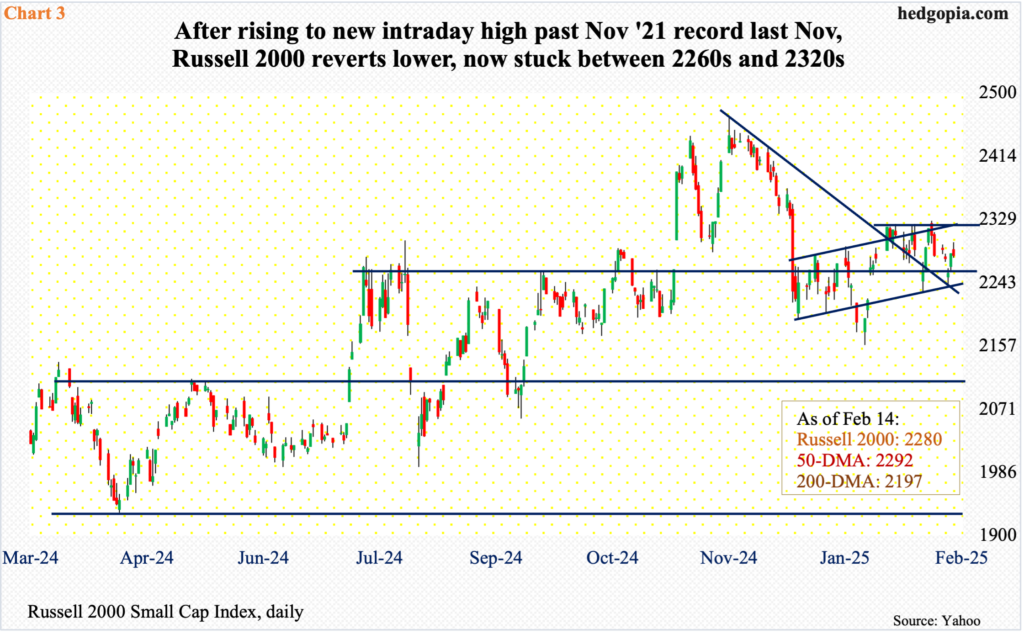
Contrast this with the Russell 2000, which continues to remain rangebound between 2320s and 2260s. Last week, the small cap index was essentially unchanged – up a mere 0.01 percent to 2280.
The Russell 2000 came under pressure after it reached a new intraday high of 2466 on November 25 (last year) – past its prior high of 2459 from November 2021. On January 13 (this year), it bottomed at 2159. But unlike the large-caps, the small cap index has for several weeks attracted sellers at 2320s. Last week, that resistance was not even tested in earnest, as a weekly high of 2298 was all it could manage.
From the bulls’ perspective, the good thing is that bids did show up Wednesday at the bottom of a nearly-two-month rising channel, the upper part of which now lines up with the 2320s resistance (Chart 3).
Small-caps’ struggle is shaping up at a time when the 50-day is pointing lower and the daily Bollinger bands are tightening. A break of 2260s, which goes back to mid-July last year, will further add insult to injury.
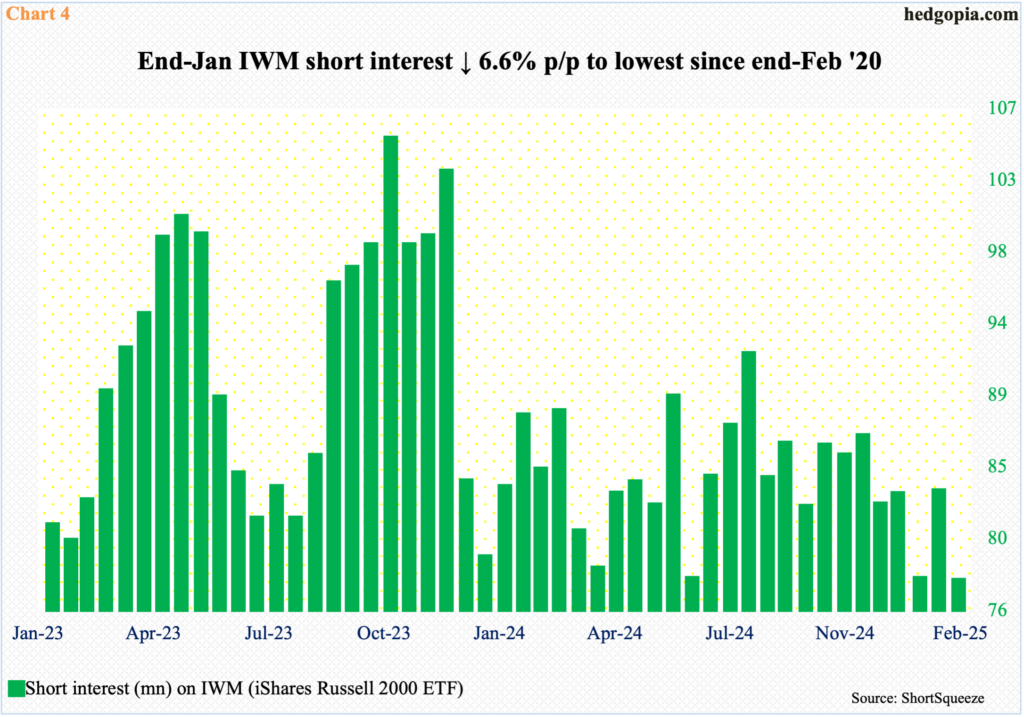
Small-cap momentum is on the back foot when shorts – seen through the eyes of short interest on IWM (iShares Russell 2000 ETF) – have all but given up. At the end of January, short interest declined 6.6 percent period-over-period to 7.76 million, which is the lowest since end-February 2020.
At the end of October 2023, when the major equity indices reached a major bottom, IWM short interest shot up to 10.5 million (Chart 4). This progressively fell, and this, in turn, helped the longs as shorts were forced to cover.
Fast forward to now, this potential tailwind is no more.
Mid-November last year, after Donald Trump was elected president, short interest stood at 8.65 million, and the shorts ran for the hills. This was around the time the Russell 2000 posted a new intraday high. The post-election short covering, however, was no help to the index, suggesting the rally was being used to lighten up by the longs.
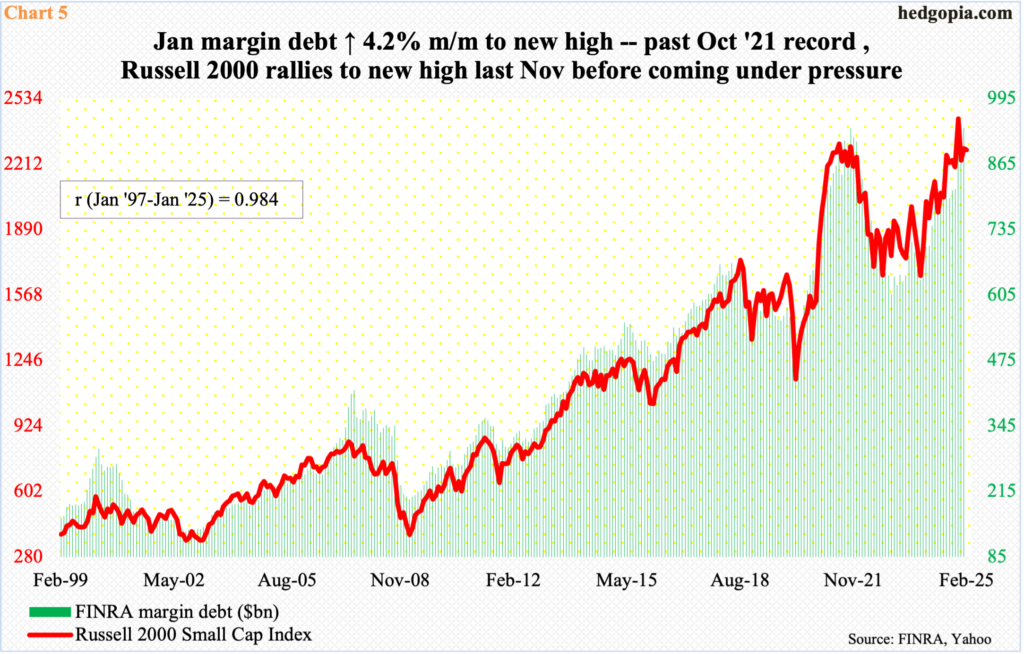
Similar dynamics are in play in margin debt.
FINRA margin debt in January grew 4.2 percent month-over-month to $937.3 billion, which finally set a new high. The old high of $935.9 billion was recorded in October 2021, which incidentally was a month before the Russell 2000 peaked back then in November. Margin debt and the Russell 2000 have a tight correlation (Chart 5).
This time, however, the two are diverging – at least now. January’s new high in margin debt is not getting reflected in the Russell 2000. It is a little early to definitively say, but it increasingly feels like the big guys used the small-cap momentum in the latter months of 2024 to lighten up. Hence the risk ahead of a breach of 2260s.
Thanks for reading!
