
Last week’s hawkish FOMC minutes sent stocks lower. The Fed not only is accelerating the recently-begun tapering of bond purchases but also getting ready to hike rates. Chances are it will also begin to shrink its bloated balance sheet in due course. Near-term notwithstanding, all this adds to a bumpy outlook for equities medium- to long-term.
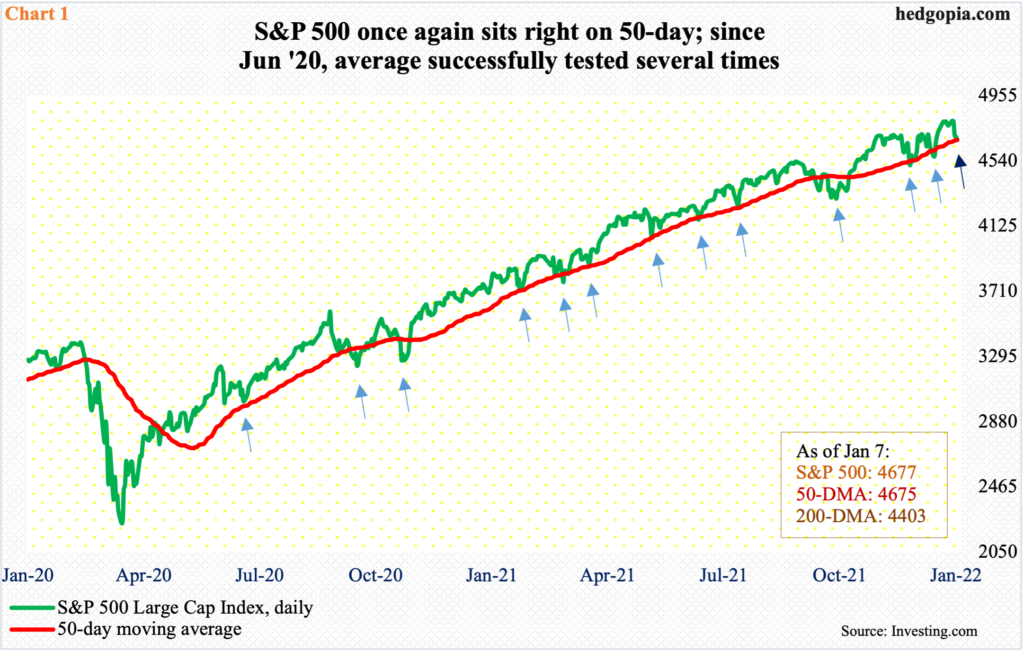
Last week, the S&P 500 posted a new all-time high but only to then drop 1.9 percent for the week. Tuesday’s record 4819 was followed by down sessions in the remainder of the week, ending Friday right on the 50-day (4675).
Going back to July 2020, the large cap index (4677) found support at the average several times (Chart 1). Twice last month, the 50-day was breached slightly but in the end bulls managed to step up in defense.
Early last month, the S&P 500 put in a low of 4495 before bids started showing up; straight-line support at 4540s was not breached by much. Then, three weeks ago, the index reversed higher after touching 4531, once again saving 4540s; the subsequent rally resulted in a seven-week breakout at 4740s, but a retest last Wednesday was a failure.
The way things are shaping up, a test of 4540s looks imminent in the sessions ahead.
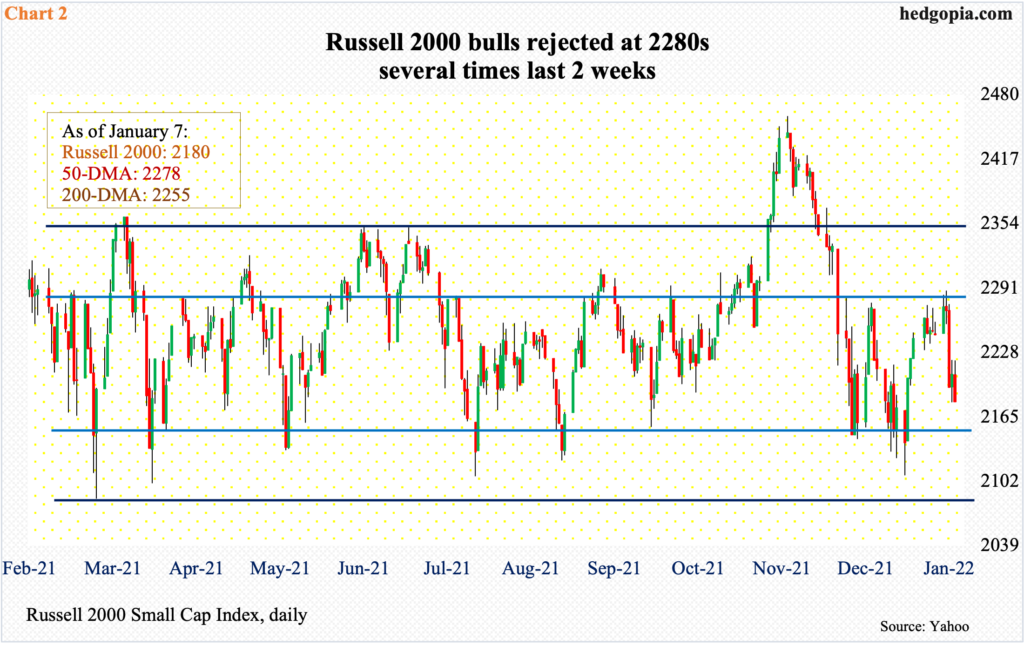
The 50-day was also where sellers showed up last week on the Russell 2000. The average (2278) currently coincides with range resistance. Several times in the last couple of weeks, small-cap bulls tried to take out 2280s, but to no avail. Last Tuesday, the index rallied as high as 2288, but only to then close out the week at 2180.
Since March last year, the Russell 2000 has been rangebound between 2350s and 2080s, and between 2280s and 2150s within this rectangle (Chart 2). On Nov 3, the small cap index broke out but was quickly followed by a failed retest on the 19th.
As things stand, risk-reward odds favor a drop toward the lower range than a rally toward the upper range.
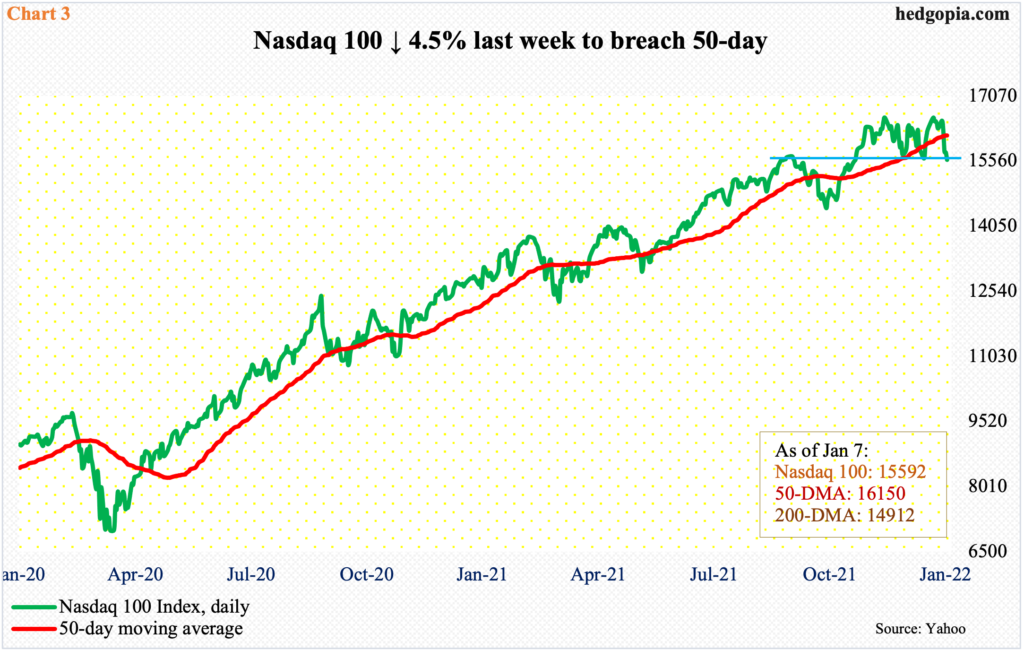
On the Nasdaq 100, the 50-day was violated last week.
Twice last month, horizontal support at 15700s was breached, but not by a whole lot. On both occasions, the rallies that followed were unable to surpass the all-time high of 16765 posted on November 22.
On December 28 in particular, a lower high of 16607 was established. In the subsequent selloff, the 50-day (16150) was lost last Wednesday, closing out the week at 15592. On a closing basis, this level makes up decent-looking support (Chart 3).
In the sessions ahead, how US interest rates behave will probably decide if this support holds.
Last week, the Nasdaq 100 was punished for a 4.5-percent drawdown. Rightly or wrongly, tech is taking a hit as interest rates are rising. Investors are beginning to take shelter away from growth.
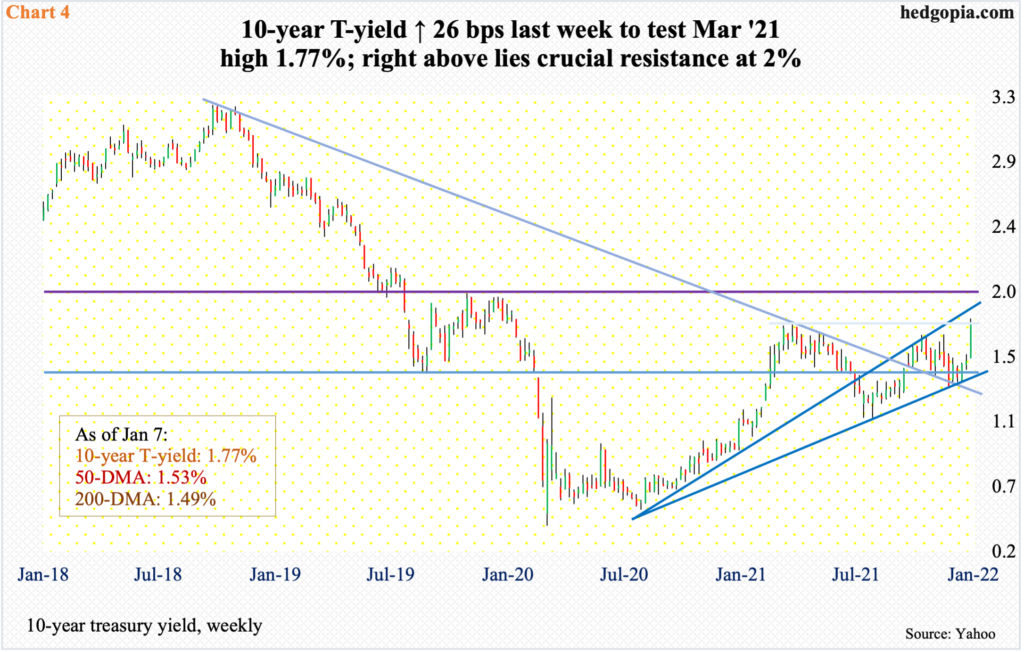
The 10-year treasury yield shot up 26 basis points last week to 1.77 percent. This was the steepest weekly rise since September 2019. Rates are currently testing the high from last March (Chart 4).
As recently as December 3, the 10-year ticked 1.34 percent intraday, so has come a long way. The daily is overbought. A takeout of 1.77 percent can hurriedly result in a rally toward two percent, which is likely to induce aggressive buying of 10-year notes, thereby putting the yield under pressure.
In this scenario, at least near term, odds favor a peak in rates sooner than later. If so, growth investors’ first instinct will probably be to buy tech. Medium- to long-term, the Fed and its hawkish message are front and center.
Rates rallied strongly last week in response to Wednesday’s minutes of the December 14-15 FOMC meeting. As it turns out, the Fed is now sounding more hawkish than the markets. Until recently, it was the other way round.
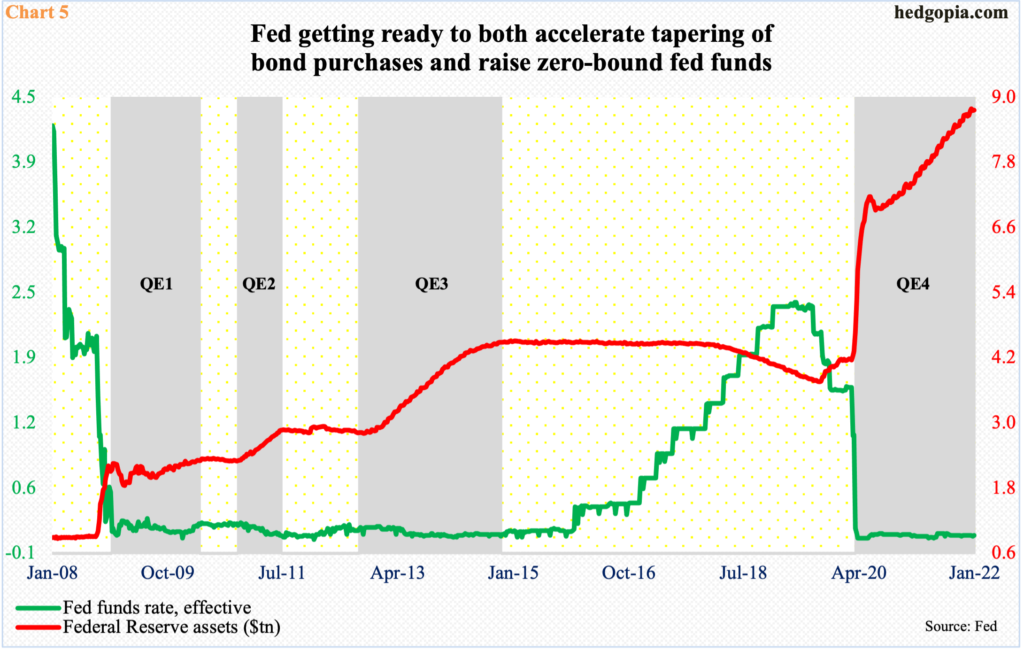
The Fed has already begun to taper its bond purchases, which until recently totaled $120 billion a month. It seems it is now keen on winding down the program as soon as possible, making way for rate hikes.
James Bullard, St. Louis Fed president, who is a voting member this year, last week said a rate hike could come as soon as March and that balance sheet runoff could take place in tandem with rate hikes. Markets were not ready to hear talk of a reduction in Fed assets, which have ballooned from $4.2 trillion in early March 2020 to $8.8 trillion. The benchmark fed funds rate has remained zero-bound for nearly as long (Chart 5).
Translation: conditions will be a lot tighter soon, and this will have come from several fronts. US equities have responded greatly to a sea of liquidity – both fiscal and monetary. The S&P 500 bottomed in March 2020 at 2192 and ticked 4819 last Tuesday – for a 120-percent surge in less than two years. Liquidity support is coming to an end – if not abruptly.
The Fed has a dual mandate of maximum employment and price stability. In order to deal with the economic disruptions caused by Covid-19, it solely focused on its employment mandate, ignoring the other mandate. Nearly two years later, the central bank is now doing a 360. For good reason.
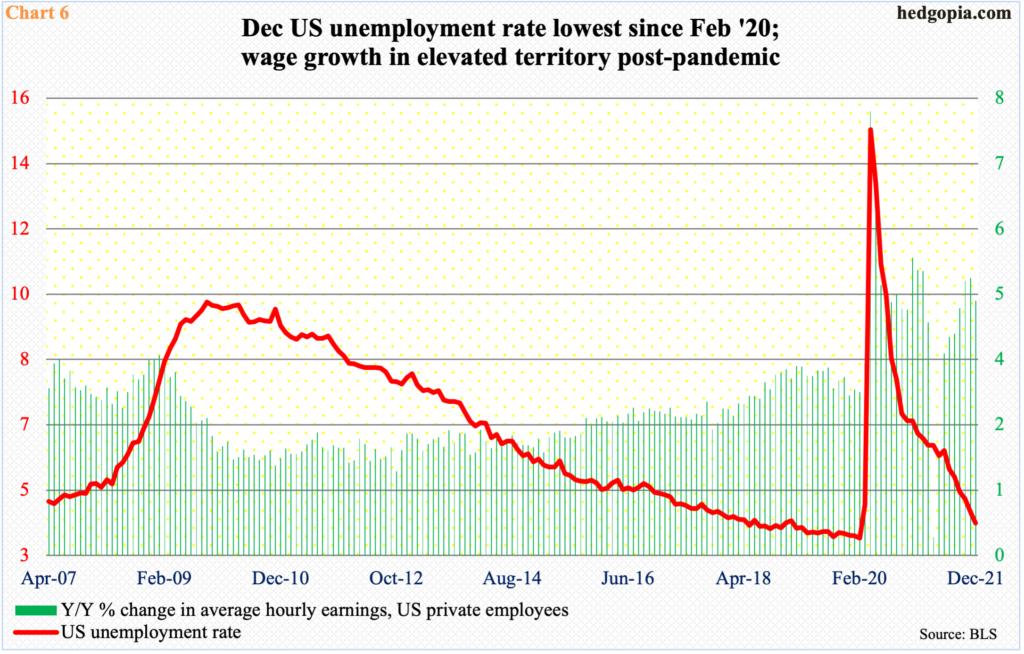
Consumer inflation is at three-decade highs. Wages have firmed up. In the 12 months to December, average hourly earnings of private-sector employees grew 4.7 percent to $31.31. As recently as last April, wages were growing a sluggish 0.3 percent (Chart 6).
Concurrently, the unemployment rate in December dropped to 3.9 percent. This was the first sub-four reading since February 2020 when unemployment was 3.5 percent. In between, post-pandemic, it shot up to 14.7 percent in April that year.
In other words, the job market has healed enough not to warrant emergency measures. The Fed is realizing this, albeit belatedly. So do the markets. Equities are just beginning to do so and may have a long way to go before the built-in optimism gets shifted several notches down.
Thanks for reading!
