
- Both bulls and bears holding on to turf; S&P 500 remains range-bound
- VIX:VXV pokes head out of oversold zone but unable to make further progress
- Volatility of volatility jumped to highest four months ago; in no-man’s land currently
Bulls and bears are duking it out. U.S. stocks cannot seem to decide which way to go. The S&P 500 large cap index remains range-bound – has been for three months now.
This is evident in the message coming out of options. The VIX to VXV ratio dipped into the high 70s in the middle of March but has since struggled to bolt out of the oversold zone (Chart 1). As of yesterday, it has again dropped back to the low 80s, and may have room to go lower.
This is as good an opportunity as any for bulls to press their case near-term.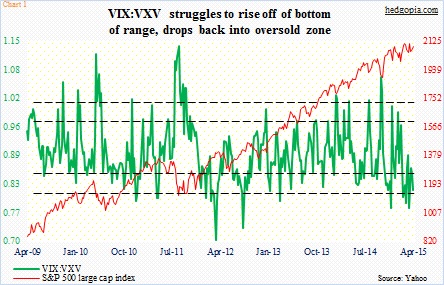
Medium-term, it is a different story.
There is a ways to go before the ratio gets overbought. When that happens, stocks come under pressure. Bears so far have not been able to cash in on the oversold conditions, and thus may be about to give an opening to the bulls. As that unfolds, the VIX will drop more than the VXV. And that is good for stocks. (The VIX measures 30-day expected volatility using implied volatilities of S&P 500 options – both calls and puts. The VXV does the same, but goes out three months.)
Although in this scenario, there is not a whole lot of downside left for the ratio. It just reentered the oversold zone. This probably means that in the medium-term, risk/reward in stocks is beginning to tilt toward the former and that there probably is not a whole lot of upside left in the S&P 500 without it first coming under decent pressure.
Any signal coming from the VVIX? This is essentially volatility of volatility, measuring the expected volatility of the 30-day forward price of the VIX index.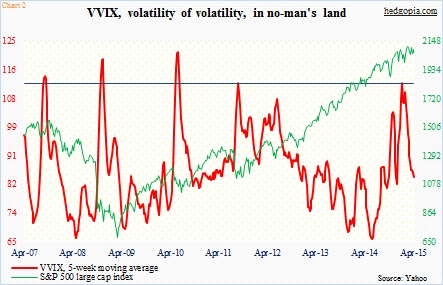
As is the case with the underlying, the VVIX tends to mean-revert. The higher it jumps, the more the downward pressure once unwinding is set in motion. When that happens, stocks like it. On December 12th last year, the index posted its highest-ever reading of 138.6; the S&P 500 closed that day at 2002. Chart 2 shows its five-week moving average, and, turns out, a reading above 100 is pretty rare. The olive line is drawn at 112. Yesterday, the 5WMA closed at just over 84 – in no man’s land, which could go either way. VVIX action probably reflects the range-bound action in the S&P 500.
Of the two, the VIX to VXV ratio may turn out to be a better signal at this moment.
