
Here is a brief review of period-over-period change in short interest in the August 1-15 period in the Nasdaq and NYSE Group as well as nine S&P 500 sectors.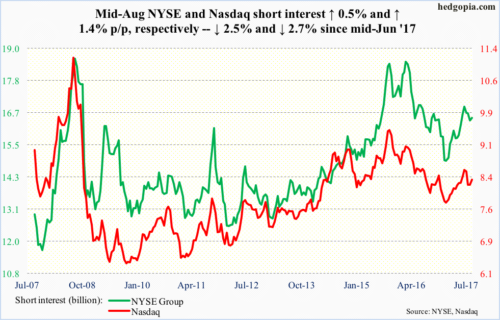
Nasdaq
Since the composite (6271.33) rallied to a new all-time high of 6460.84 on July 27, it has been making lower highs.
Monday saw a hammer reversal, but the bulls are struggling to genuinely build on it. They are currently locked into a tug of war with the bears for control of the 50-day moving average (6276).
NYSE Group
On August 8, the composite (11773.8) rallied to yet another high of 12019.85, but that session produced a reversal candle. The subsequent selloff found support at 11600-11700, which goes back to February this year.
Near-term, support-turned-resistance lies at 11850, which also approximates the 50-day (11837).
…
XLB (SPDR materials ETF)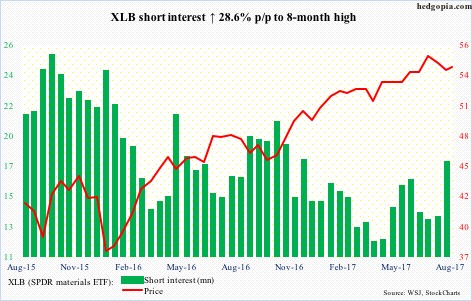
Support at 53.50 has been defended twice this month, including last Friday. Above, the July 25 all-time high of 55.92 stands.
In essence, XLB (54.26) is caught in between, with the 50-day (54.41) beginning to go flat, and repelling rally attempts for the past several sessions.
Shorts are emboldened.
XLE (SPDR energy ETF)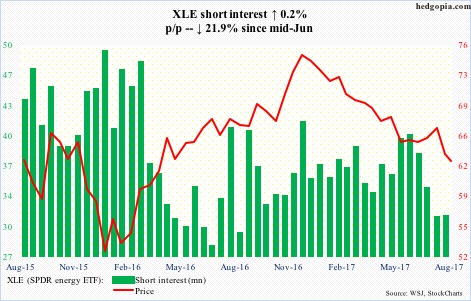
XLE (62.72) was down in six of last seven months. August-to-date, it is down another 5.9 percent. The hammer reversal on July 7, followed by a rally, proved transient.
It is still trapped in a downtrend channel from last December, the upper bound of which will be tested just under 64.
XLF (SPDR financial ETF)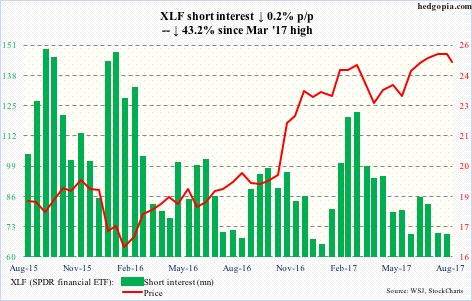
On August 8, XLF (24.74) surged intraday to a new all-time high of 25.59, but only to reverse hard. The session produced a gravestone doji. If the breakout stuck, this would be a major development.
In May 2007, XLF retreated after hitting 25.21. The level was then tested in March and July this year – unsuccessfully.
At least near term, bears’ odds grow if they can take out 24.50, which the bulls’ defended Monday.
XLI (SPDR industrial ETF)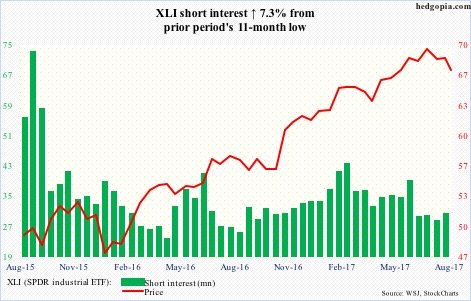
XLI (67.18) bulls lost support at 68. Ditto with the 50-day (68.39), which is now slightly pointing down.
This is an opportunity for shorts, who have adopted a wait-and-see approach for the past several weeks.
There is support at 65.70.
XLK (SPDR technology ETF)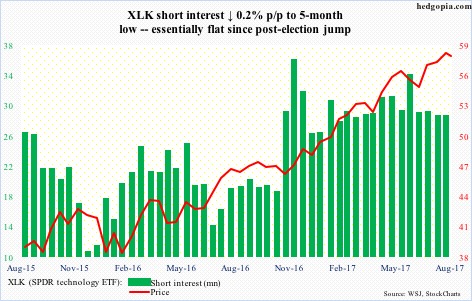
Near-term support at 56.70, which also approximates the 50-day, was defended twice this month. But the bulls are having difficulty taking out resistance just north of 58.
Short interest surged post-election last November. Despite the massive rally in XLK (57.71) this year, shorts are staying put.
XLP (SPDR consumer stables ETF)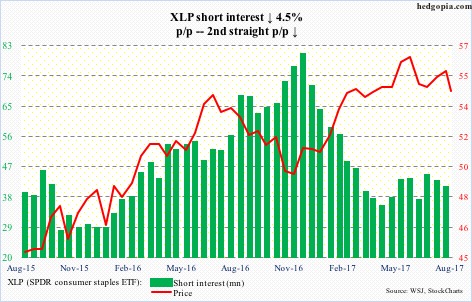
XLP (54.49) bulls defended support at 55 several times this month, only to lose it Thursday when the ETF got smacked for a 1.4 percent drop. In July, support at 54 was defended, and this likely is in play.
XLU (SPDR utilities ETF)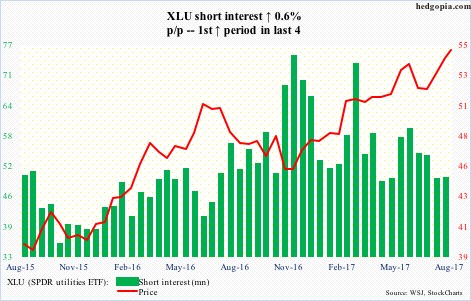
XLU (54.96) stages yet another breakout – this time out of 54-plus.
In May this year, it broke out of 51, followed by a successful retest in July.
That said, the daily chart is way extended. A retest of the recent breakout is probably around the corner.
XLV (SPDR healthcare ETF)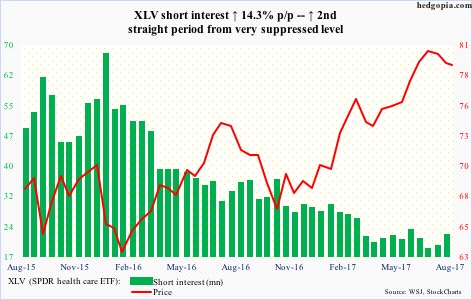
XLV lost the 50-day (79.45) two weeks ago. Several attempts since to recapture the average have failed. It also lost – albeit barely – near-term support at 79. But the ETF (78.93) is not that far away from these levels.
Earlier in May, XLV had a major break out of nearly two-year resistance at 75.
XLY (SPDR consumer discretionary ETF)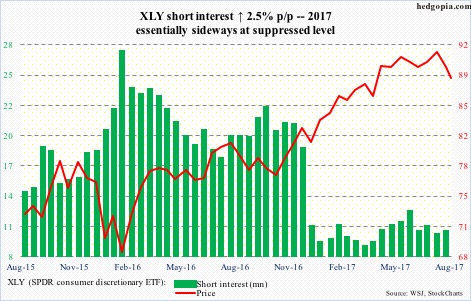
XLY (88.41) was on the verge of completing a double-top formation, but the bulls stepped up, defending 88 in Monday’s hammer session. Technicians would be eyeing 84 if the neckline convincingly broke – which could embolden shorts.
Near term, the neckline likely gets tested again.
Thanks for reading!
