Here is a brief review of period-over-period change in short interest in the August 16-31 period in the Nasdaq and NYSE Group as well as nine S&P 500 sectors.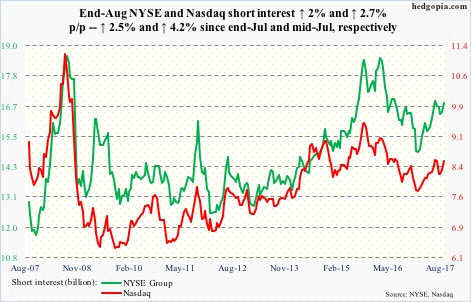
Nasdaq
After three weeks of lingering, the composite (6454.28) pushed past its 50-day moving average toward the end of August. This was preceded by a 4.1-percent drop since the index rallied to a new all-time high of 6460.84 on July 27.
Short interest – up 4.2 percent since mid-July – remains high, and this has been a consistent source of support for the bulls, as shorts get squeezed on the way up and are tempted to cover on the way down.
NYSE Group
A new closing high on the composite (12057.12) on Tuesday.
Prior to this, on August 18, support at 11600-11700, which goes back to February this year, was successfully tested, followed by recapturing of support-turned-resistance at 11850 and the 50-day.
As is the case with the Nasdaq, short interest remains high on the NYSE.
…
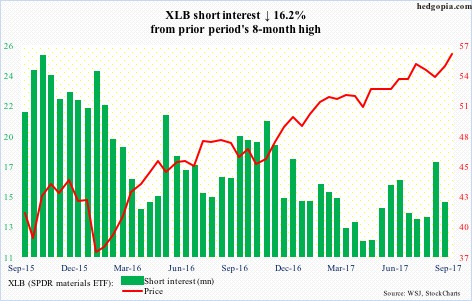
During the August 1-15 period, short interest on XLB ($56.20) jumped to an eight-month high. Shorts obviously got emboldened by a 4.5-percent drop since the ETF peaked at $55.92 on July 25.
But the bears were not able to crack support at $53.50. Tuesday, the ETF rose to a new intraday high $56.39. Shorts, who may have already gotten squeezed in the August 16-31 period, likely cut back more.
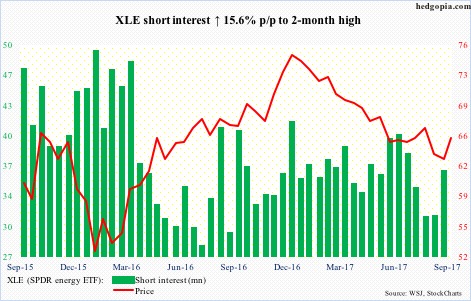
After peaking in December last year, XLE ($65.41) traded within a falling channel, until it broke out recently – although rather meekly. It has rallied nicely since it bottomed at$ 61.80 on August 21.
There is room for the ETF to continue higher on the weekly chart, but the daily is looking extended. If the weekly prevails, there is room for short squeeze.
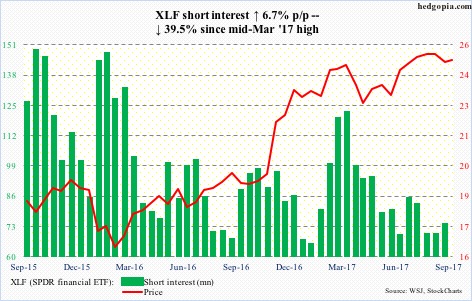
XLF’s ($24.81) break last month out of 10-year resistance at $25-plus culminating in a new all-time high of $25.59 on August 8 proved false. That session produced a gravestone doji, followed by a quick seven-percent drop until the 200-day was defended last week.
The ETF is right underneath the 50-day ($24.86), and has cleared broken-support-cum-resistance at $24.60. Short interest ticked up a tad – probably just in time to get squeezed.
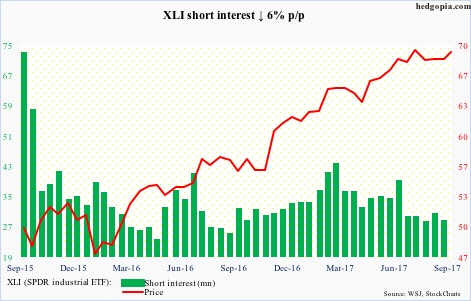
Since peaking at a new all-time high of $69.57 on July 14, XLI ($69.19) traded along a falling trend line, which was broken last Friday.
If it rallies to a new high, this would not be on the back of short squeeze. Short interest remains muted.
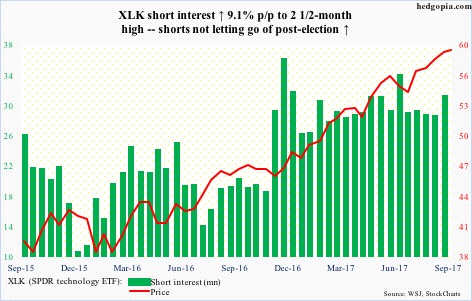
XLK ($58.99) shorts’ doggedness in staying put with the post-election surge in short interest must be a blessing in disguise for the bulls.
The ETF rose to a new all-time high of $59.03 on September 1 – surpassed Tuesday by $0.07. This preceded defense of the 50-day – now rising – on August 21.
XLP (SPDR consumer stables ETF)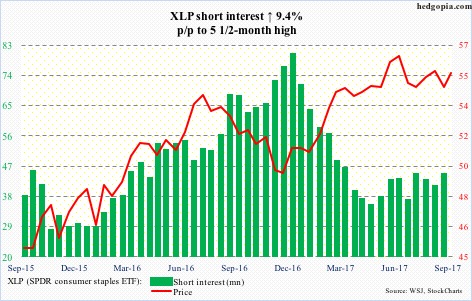
After loss on August 24 of support at $55, XLP ($55.55) bulls a couple of sessions later managed to save $54-plus.
The ETF, having peaked on June 5 at $56.92, is in damage-repair mode. The bulls need to take out $55.60 where a trend line from that high meets.
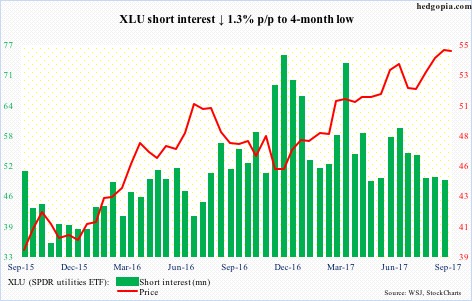
Breakouts galore on XLU ($54.90), which broke out of $51-plus in May. This was followed by a successful breakout retest in July. Soon followed another break out of $54-plus in August. Monday, it rallied to another all-time high of $55.90, but not before dropping 1.7 percent in the very next session.
Nearest support lies at $54-plus.
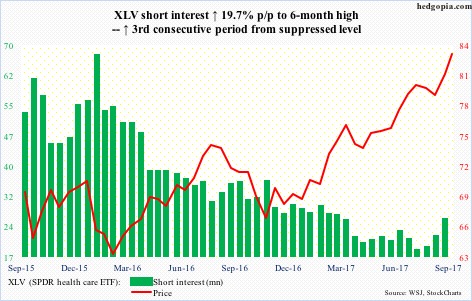
XLV ($83.36) bulls forced another breakout four sessions ago – this time out of $81.
Shorts, who otherwise have not been very aggressive of late, have added in the past month and a half, so likely played a role in the recent breakout.
In May this year, the ETF witnessed a major break out of nearly two-year resistance at $75.
XLY (SPDR consumer discretionary ETF)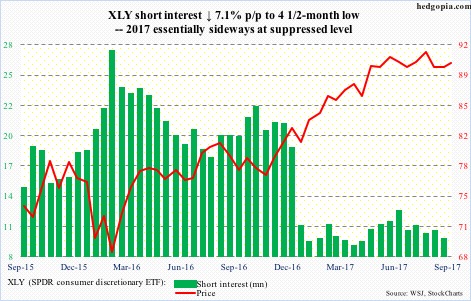
XLY’s ($90.04) support at $88 was tested twice in August, and, kudos to the bulls, it held on both occasions. A loss of this support would complete a double-top formation, with technicians eyeing $84 as the new target.
Shorts continue to remain in wait-and-see mode.
Thanks for reading!

