
With XLF (SPDR financial ETF) short interest near a multi-month low and the Treasury yield curve continuing to come under pressure, U.S. financials are acting weak, even breaking down.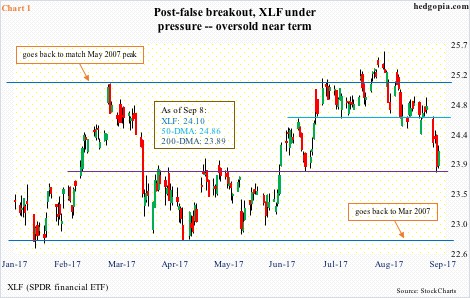
Back in March this year, XLF unsuccessfully tested the prior high of May 2007, then coming under pressure for the next month and a half before finding support at a level going back to March 2007 (Chart 1).
The subsequent rally had it once again test that resistance – initially unsuccessfully then with a breakout early August. Turns out the breakout was false.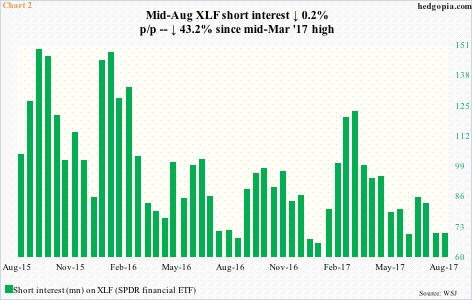
During all this, short interest on XLF dropped from 121.4 million mid-March to 68.9 million mid-August. (End-August numbers will be reported tomorrow.)
Shorts probably got squeezed when the ETF began to rally end-March/mid-April. Now, short interest is near a seven-month low (Chart 2).
This trend was also evident in KBE (SPDR S&P bank ETF) and KRE (SPDR S&P regional banking ETF), with short interest on KBE down from 7.5 million end-April to four million mid-August, and on KRE from 28.9 million end-May to 19.3 million mid-August (not shown here).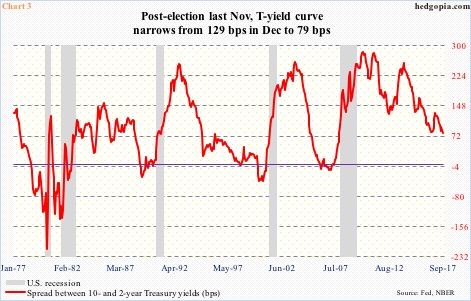
Short-squeeze fuel is losing its octane. Concurrently, the Treasury yield curve continues to narrow.
Post-presidential election last November, financials rallied massively. XLF, for instance, broke out of multi-year resistance at just under 20. In November alone, it rallied 14 percent!
The yield curve (10s/2s), however, failed to cooperate, peaking at 129 basis points last December. It has since narrowed to 79 basis points (Chart 3).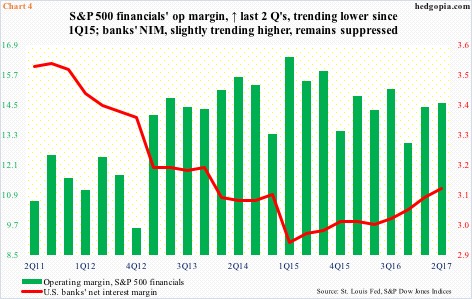
Banks in general borrow short and lend long. A steeper curve benefits them.
On November 8 last year, two-year Treasury notes yielded 0.87 percent, peaked at 1.41 percent on July 3 and closed last week at 1.27 percent. Concurrently, 10-year yields were 1.86 percent on November 8, peaked at 2.62 percent in March and closed last week at 2.06 percent.
The short end of the curve has shifted up in response to the 100-basis-point increase in the fed funds rate since December 2015, even as the long end acts worried.
Net interest margin is the culprit.
U.S. banks’ NIM has been trending higher since 2Q15 – from 2.95 percent in 1Q15 to 3.13 percent in 2Q17 – but remains suppressed in a larger scheme of things. S&P financials’ operating margin in the meantime peaked at 16.41 percent in 1Q15 (Chart 4).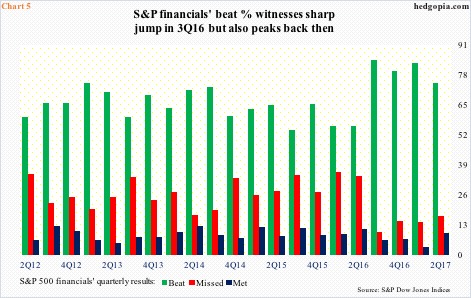
Incidentally, XLF’s breakout in November also coincided with a rather sharp spike in the percentage of S&P financials beating quarterly consensus estimates. In 2Q16, 55.4 percent beat, then jumping to 84.4 percent a quarter later. By 2Q17, this had decreased to 74.2 percent. In the meantime, the ‘missed’ percent went up from 9.4 percent in 3Q16 to 16.7 percent in 2Q17 (Chart 5).
XLF reached an all-time high of 25.59 on August 8. It was a reversal session, producing a gravestone doji (Chart 1). Subsequently, it went on to lose support at 24.60 as well as the 50-day. Last Thursday and Friday, the 200-day was tested and held – for now.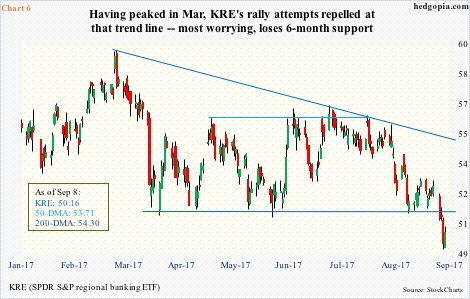
More importantly perhaps, KRE lost both averages, with a death cross two weeks ago. It peaked earlier than XLF – on March 2 at 59.28 in a bearish engulfing session. Last week, it lost nearly 10-month horizontal support at 51 and change (Chart 6).
These regional banks tend to be exposed domestically more than their XLF brethren, and thus are probably sending a loud and clear message.
The primary reason behind financials’ rally post-election was expectations for a reduction in regulations, a steeper yield curve and higher growth rate in the economy. Investors/traders are obviously rerating these expectations, hence recent selling.
A crucial test probably lies ahead.
In the very near term, 10-year yields have room to rally – if nothing else just to unwind the oversold condition they are in – with XLF in tow. In this scenario, selling pressure can reappear at broken-support-cum-resistance at 24.60 (Chart 1).
Thanks for reading!
