
Here is a brief review of period-over-period change in short interest in the November 16-30 period in nine S&P 500 sectors.
XLB (SPDR materials ETF)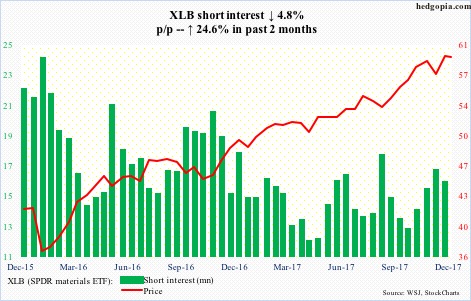
In a shooting star session on December 4, XLB (59.51) rose to a new all-time high of 60.17, but the 60 level, or just below 60, has resisted rally attempts for six weeks now.
Last week also produced a weekly long-legged doji.
There is decent support at 57.70, with the 50-day moving average at 58.58.
XLE (SPDR energy ETF)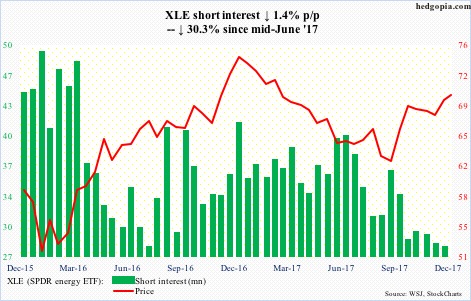
Once again, on December 4, XLE (69.78) was denied at Fibonacci resistance, as it reversed hard after hitting 70.75.
Between December 12 last year and August 21 this year, the ETF dropped intraday from 76.04 to 61. A 61.8-percent retracement of that decline works out to 70.29. On November 7, XLE retreated after hitting 70.47, and again yesterday after rallying to 70.14.
Shorts have been actively cutting back of late, and from the squeeze viewpoint, that has not helped the bulls.
XLF (SPDR financial ETF)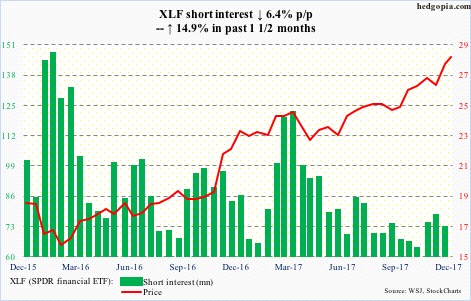
XLF (27.94) produced a weekly long-legged doji last week. This comes in the wake of a powerful break out of 26.90 in the prior week.
A little bit of fatigue is setting in, but that breakout is still intact – in fact, was successfully tested on December 1.
The 10-day has not been tested in the past nine sessions, but is likely to happen in the sessions ahead.
XLI (SPDR industrial ETF)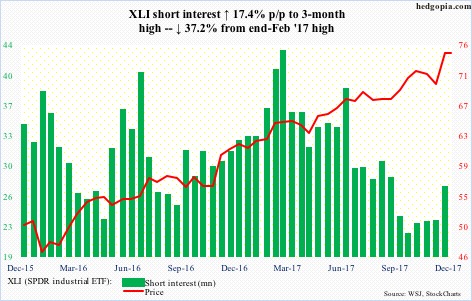
XLI (74.54) surged past the prior high of 73.20 on November 30, with a breakout retest shortly after.
The bulls have the ball, but it is getting difficult to keep up the momentum.
XLK (SPDR technology ETF)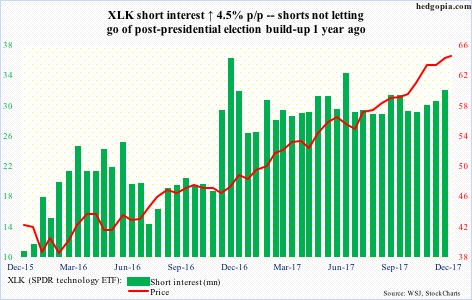
Since peaking at 64.77 on November 28, XLK (64.15) came under pressure until the bulls defended the 50-day last Wednesday. The subsequent rally has seen it past both the 10- and 20-day. The daily upper Bollinger band lies at 64.85.
At least near term, seasonality favors the longs. And shorts, although hurting, continue not to give up.
XLP (SPDR consumer stables ETF)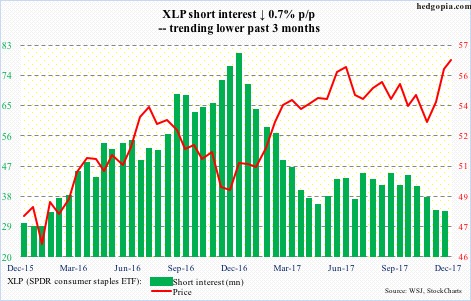
After breaking out of a falling trend line from June this year, XLP (56.58) went sideways for several sessions before building on that breakout. Last Wednesday, it rallied to a new all-time high of 56.99.
In the last couple of sessions, the 10-day was successfully tested.
In a worse-case scenario, support lies at 55-55.50.
XLU (SPDR utilities ETF)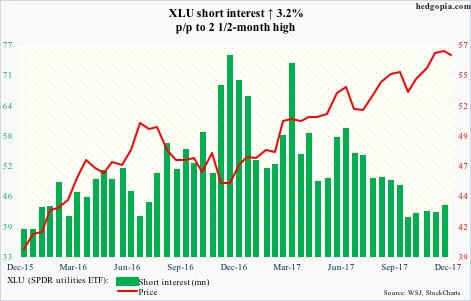
XLU (56.21) just bounced off of the daily lower Bollinger band, and has room to rally near term. Last week’s low also defended horizontal support at 55, which is where the 50-day (55.15) lies.
XLV (SPDR healthcare ETF)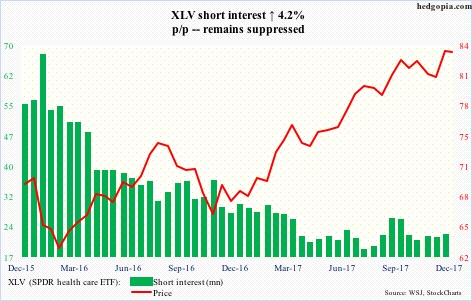
On December 4, XLV (83.36) produced an ominous-looking candle for a 1.2-percent drop. The bears have not been able to make much of it. The ETF did not even go test support at just under 81, which the bulls broke out of three months ago.
The all-time high of 84.31 on October 23 is 1.1 percent away.
XLY (SPDR consumer discretionary ETF)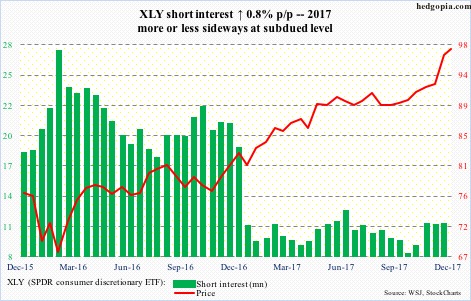
On December 4, XLY (97.46) produced a nasty looking shooting star just outside the daily upper Bollinger band. The subsequent selloff was defended at the 10-day. It has since grinded higher, but some signs of fatigue are showing up. On the weekly chart, last week produced a spinning top.
The ETF had an important break out of 92 one month ago.
Thanks for reading!
