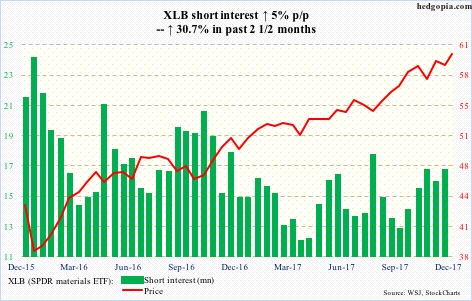
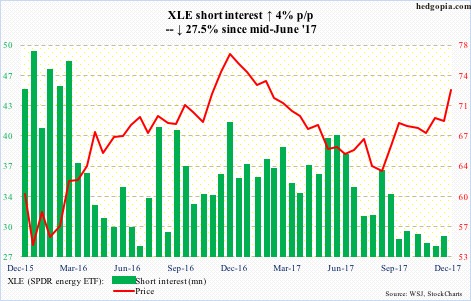
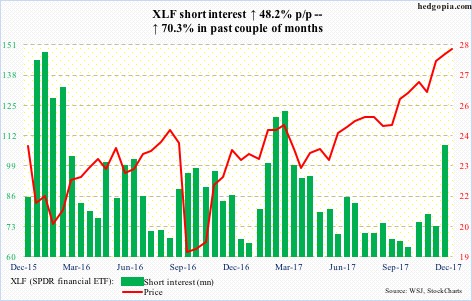
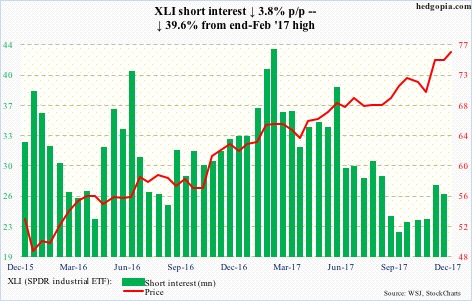
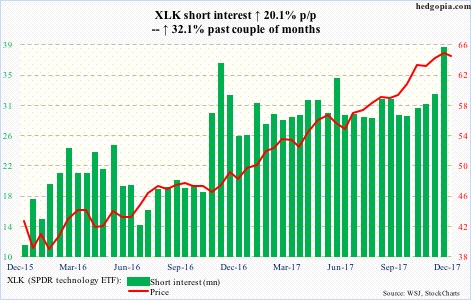
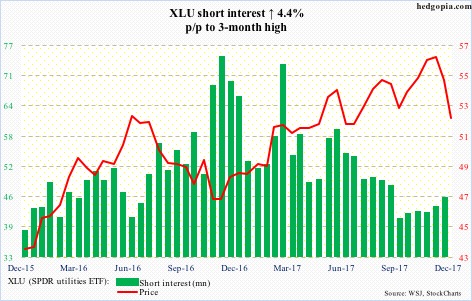
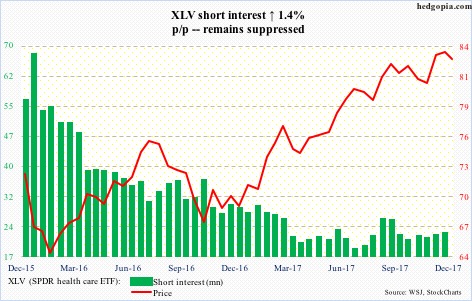
Here is a brief review of period-over-period change in short interest in the December 1-15 period in nine S&P 500 sectors.
XLB (60.37) continued to grind higher all along the daily upper Bollinger band, rising to a new intraday all-time high of 60.49 on Wednesday.
The daily is beginning to look extended. Near term, the bulls need to defend the 60-ish level, which approximates the still-rising 10-day moving average (59.86).
Down below, there is decent support at 57.70, with the 50-day at 59.
Such is the momentum behind XLE (72.36) currently that the bulls have been bulldozing past one after another resistance.
Between December 12 last year and August 21 this year, the ETF dropped intraday from 78.45 to 61.80. A 61.8-percent retracement of that decline works out to 72.09. This is a level worth watching. (Using dividend-adjusted prices, this resistance lies at 70.29.)
In the last four sessions, the ETF extended well outside the daily upper Bollinger band. A pause looks imminent. Nearest support lies at 70.50.
XLF (28) has essentially gone sideways for nearly a month now. There is a bull-bear tug of war around the 10- and 20-day. A potentially bearish cross-under is likely in the works. Bollinger bands are contracting.
If the bears take out short-term support at 27.60, the odds of a test of support at 26.90 rises.
This scenario falls flat on its face should the bulls manage to hang tough and force a mini breakout. Shorts have gotten aggressive of late, and can get squeezed.
XLI (75.66) bulls still possess the ball, but are also beginning to give out signs of fatigue.
That said, the ETF is comfortably above shorter-term averages.
Nearest support lies at 74.50-ish. Worse, 73 comes into play, which XLI broke out of late November this year.
After gapping up to an intraday all-time high of 65.20 on the 18th this month, XLK (64.18) has come under slight pressure.
The bears have managed to push it under the 10-day, but not the 20-day just yet. The 50-day (63.27) – which the bulls have not lost since July this year – is not that far away.
Shorts have gotten really aggressive, and they may be eyeing a slight opening. Let us see how far they can take it.
Incidentally, the ETF peaked at 65.44 in March 2000. A failure here can have consequences.
XLP (SPDR consumer stables ETF)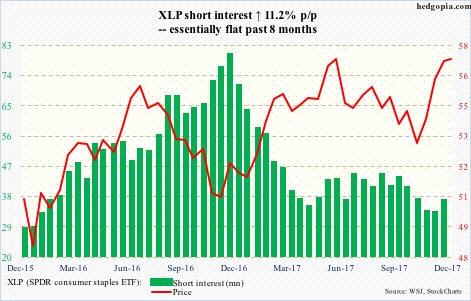
On the 18th this month, XLP (56.99) tested the June 5th (this year) all-time high of 57.36, and was denied. This preceded quite a rally, having bottomed at 52.43 on November 7 this year.
The bulls for sure would hope this is just a pause before another leg higher. The ETF has essentially been sideways this month, during which the 10-day was tested several times – so far successfully.
On the daily chart, XLU (52.36) is severely oversold, but is yet to stabilize.
It peaked on November 15 this year, before getting bruised badly this month, losing both the 50- and 200-day in the process. In recent sessions, the bears showed up at broken support-turned-resistance at 52.65, which the bulls now need to take out. An encouraging sign from their perspective: Wednesday produced a doji – also an inside day.
Unable to break past the October 23rd all-time high of 84.31 after several tries this month, XLV (83.07) bulls have gone on to lose the 10-day, closing Wednesday right on the 20-day. The 50-day (82.40) is intact.
There is decent support at 81.
XLY (SPDR consumer discretionary ETF)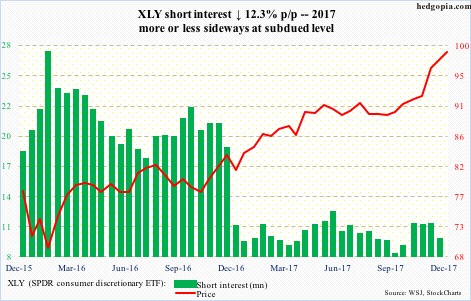
On December 4, XLY (99) intraday rose to 98.37 but only to produce a nasty looking shooting star just outside the daily upper Bollinger band. The subsequent selloff was defended at the 10-day.
That high has now been superseded, with Wednesday’s intraday high of 99.39 matching the high of three sessions ago.
As extended as the ETF is, momentum is yet to break, although slowing. The daily MACD just crossed under.
Thanks for reading!

