
Here is a brief review of period-over-period change in short interest in the April 16-30 period in nine S&P 500 sectors.
XLB (SPDR materials ETF)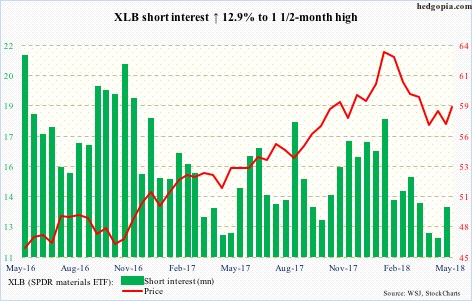
Since peaking at 64.17 on January 26, XLB (58.49) has persistently made lower highs. A trend line drawn from that high extends to 58.50-59.
The ETF has rallied since making a higher low early this month, with Wednesday up 1.4 percent – past both 50- and 200-day moving averages, but barely. The bulls would have strengthened their case if they can take out the April 18 high of 60.25.
(The accompanying charts use closing prices, hence look different.)
XLE (SPDR energy ETF)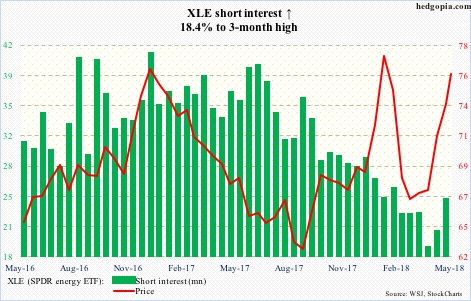
XLE (76.05) went sideways for a couple of months before breaking out of 68.70 a month ago. It digested the recent rally by once again going sideways for three weeks. On Wednesday, it broke out of this congestion.
But this time around, signs of indecision have emerged, with Wednesday producing a candle with a long wick. The daily chart is getting extended. Short-term support lies at 74.50-ish.
XLF (SPDR financial ETF)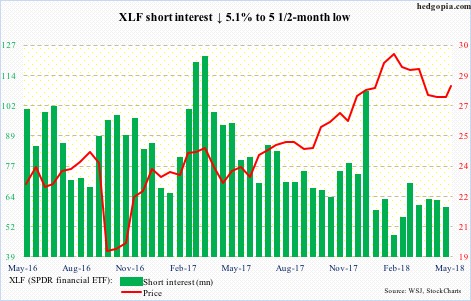
On Thursday last week, XLF (28.05), which of late has struggled to follow interest rates higher, lost the 200-day by dropping to 26.46 intraday, although the session ended with a hammer. The ETF rallied the next four sessions. Wednesday, it captured the 50-day, but not by a whole lot.
Ideally, the bulls would like to build on recent momentum and go test a falling a trend line from late-January highs, which lies around 29. They have to conquer 28.20-ish first.
XLI (SPDR industrial ETF)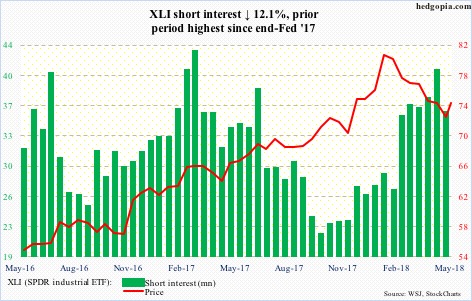
A falling trend line from the January 29 all-time high of 80.96 gets tested around 75.25. XLI’s (74.05) 50-day lies at 74.54. A test of these levels looks imminent, particularly if the bulls force a squeeze. Short interest remains elevated.
XLK (SPDR technology ETF)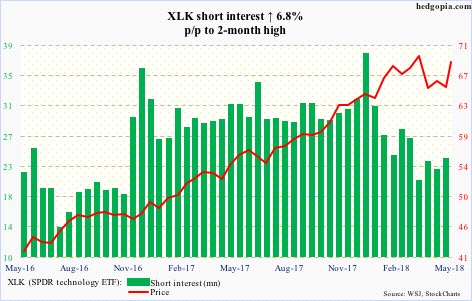
With higher lows since the February 9 reversal low of 60.97, XLK (69.08) rallied past the 50-day last Friday and built on it further this week. That said, it has rallied to a potentially important zone. A retreat right around here can form the right shoulder of a potential head-and-shoulders pattern, hence worth watching.
The daily chart is beginning to get extended.
XLP (SPDR consumer stables ETF)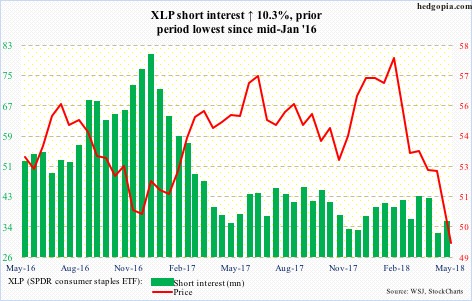
XLP (49.25) peaked at 58.95 on January 29. It has been nothing but downhill since. Shorts have not really taken part in this decline, which also translates to a lack of potential fuel for squeeze.
The ETF has gone sideways the past several sessions, which can be part of a basing action, provided last Thursday’s low of 48.76 is not breached.
XLU (SPDR utilities ETF)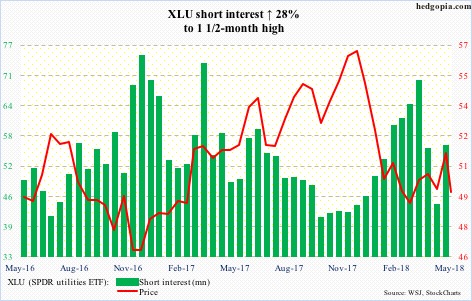
Beginning early February, XLU (49.61) played ping pong within an ascending channel for three months. It fell out of it this week. It also lost the 50-day. The 10-year Treasury rate (3.04 percent) once again is hammering on resistance at three percent, and this has not brought good news to bond proxies such as the utilities.
XLV (SPDR healthcare ETF)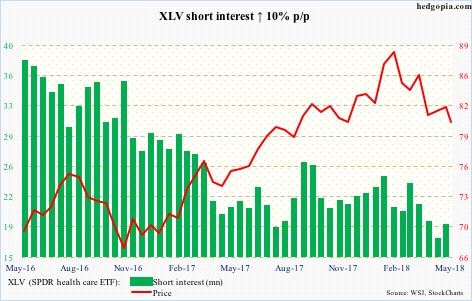
Shorts’ disinterest continues.
On the price front, once again XLV (80.73) is testing crucial support at 79-79.50. The bulls cannot afford to lose this.
The ETF is near the daily lower Bollinger band. A bounce can occur, but overhead resistance is aplenty.
XLY (SPDR consumer discretionary ETF)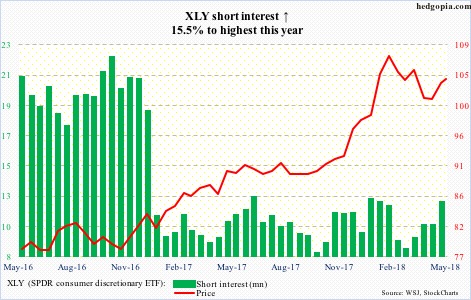
XLY (104.29) closed Wednesday just beneath a trend line from the all-time high of 109.34 reached on January 29. This rests at 104.70-ish, which also approximates short-term horizontal resistance.
The ball lies with the bulls as they have the advantage of higher lows the past five weeks. The 50-day (103.11) lies underneath.
Thanks for reading!
