
Here is a brief review of period-over-period change in short interest in the May 16-31 period in nine S&P 500 sectors.
XLB (SPDR materials ETF)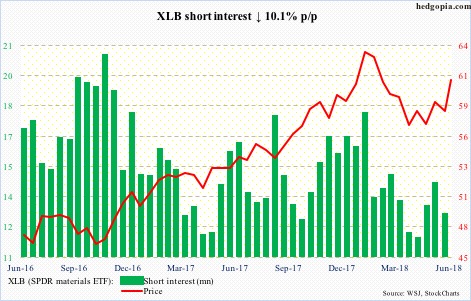
XLB (60.92) has made higher lows since early April, rallying past both 50- and 200-day moving averages. In the past four sessions, it remained in the vicinity of resistance at 61. A breakout opens the door for a test of the upper bound of a two-and-a-half-month ascending channel, which lies around 61.50. Failure here means possible start of unwinding of daily overbought conditions.
XLE (SPDR energy ETF)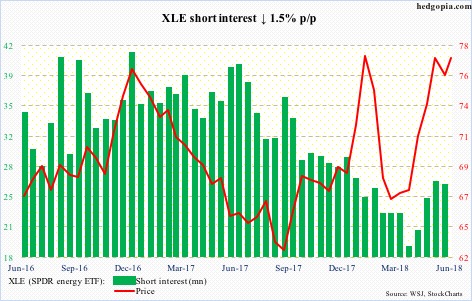
A three-year high of 79.42 reached on May 22 stands. Bulls seem to once again want to go after resistance at 78-79. A week after that high, XLE (77.30) fell to 73.65, before coming under buying pressure. On the daily chart, there is still some room to rally. But the aforementioned resistance can prove to be a tough ceiling.
XLF (SPDR financial ETF)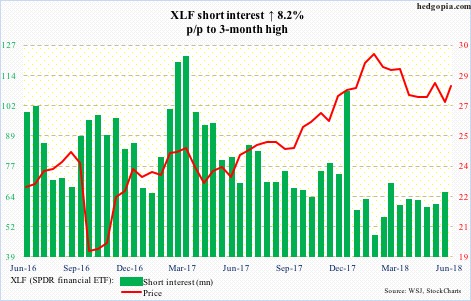
XLF (28.02) continues to remain bound by a falling trend line from late-January high. Monday’s intraday high of 28.27 was repelled at that resistance. The ETF’s inability to break out likely has emboldened shorts, who have added a tad in the past few months.
Bulls cannot afford to lose support at 26.75. Before that lies support at the 50- and 200-day.
XLI (SPDR industrial ETF)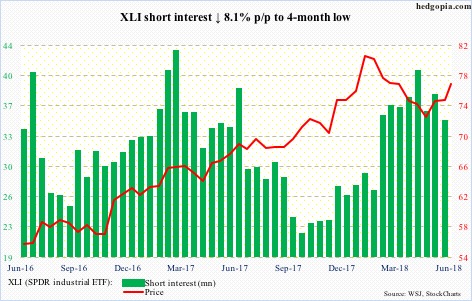
XLI (76.59) came under renewed selling pressure late April-early May, during which the February 9 low was breached. Afterwards, bulls did step up to defend support at 70.
Shorts got aggressive beginning first half of February. They are more or less staying with it. At least a mini squeeze is possible if the ETF takes out 76.80.
XLK (SPDR technology ETF)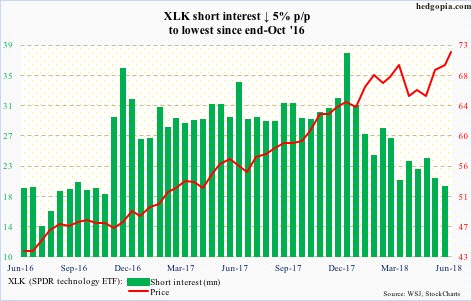
XLK (71.76) rose to a new all-time high of 72.38 last Wednesday, rallying nearly 19 percent since the February 9 low. Did shorts contribute to this? Big time. Post-presidential election in November 2016, they shifted into a much higher gear. All that buildup in short interest is now gone. This at the same time also means no more squeeze fuel – or substantially less of it.
XLP (SPDR consumer stables ETF)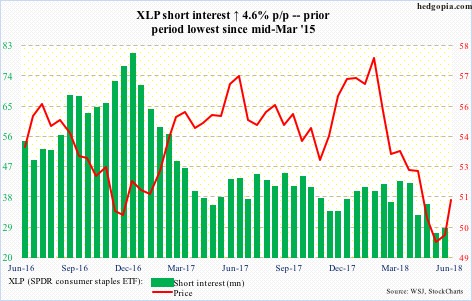
Finally a breakout! After bobbing up and down within a slightly rising channel for five weeks, XLP (51.25) broke out last Friday, also recapturing the 50-day. Unfortunately for the bulls, potential fuel for squeeze remains suppressed.
The daily chart is getting extended. There is decent support at 50.50-51.
XLU (SPDR utilities ETF)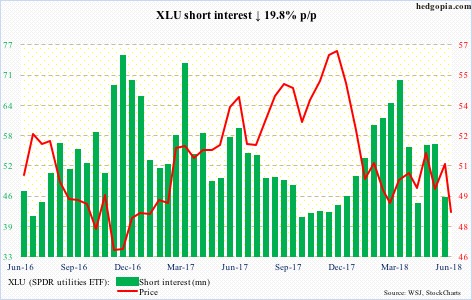
Toward the end of May, XLU (48.59) faced resistance at the underside of a broken three-month ascending channel. The drop since has the ETF once again test support at 48, which is a must-hold, and likely holds. The daily chart is oversold.
XLV (SPDR healthcare ETF)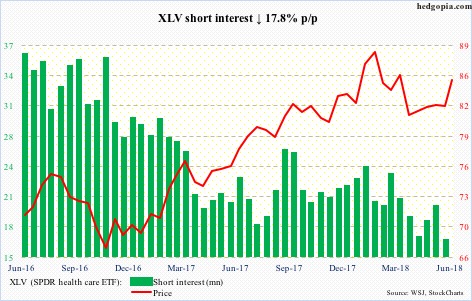
Since early April, XLV (85.20) has made higher lows as well as higher highs. It is currently at the upper end of that channel, with daily overbought conditions. This is an opportunity for shorts, who, after getting burned post-presidential election in November 2016, continue to hesitate.
XLY (SPDR consumer discretionary ETF)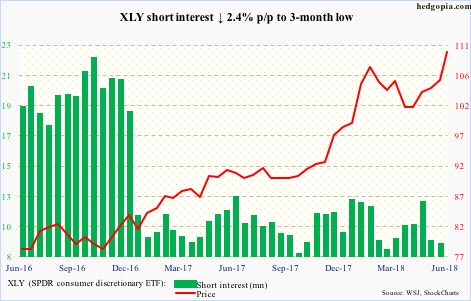
XLY (110.36) shorts continue to play defense – rightly so. The ETF Monday reached yet another new high, rallying all along the daily upper Bollinger band the past three weeks, although volume is a suspect. Short-term support now lies at 109. Daily conditions are way extended.
Thanks for reading!
