Here is a brief review of period-over-period change in short interest in the June 16-29 period in nine S&P 500 sectors.
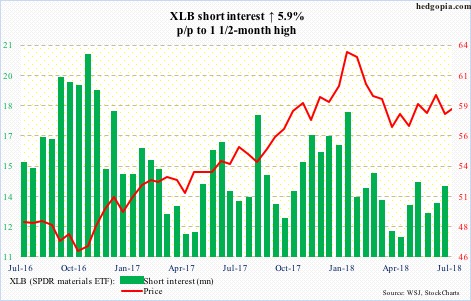
XLB ($58.47) bulls late June defended support at $57-plus. Subsequently, the ETF pushed higher past both 50- and 200-day moving averages (merely $0.36 separate the two), but it proved fleeting. The averages have been lost. The daily chart is overbought. Odds favor the aforementioned support gets tested again.
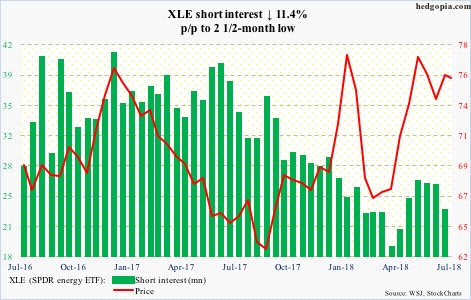
After going sideways at the 25-26 million range for a month and a half, XLE ($75.73) short interest fell 11.4 percent during the reporting period. The ETF rallied 2.4 percent in that time. Tuesday, a daily shooting star showed up right on the upper Bollinger band. Resistance at $78-79 has proven tough to crack. The path of least resistance is down near term, with decent support at $72.50-ish.
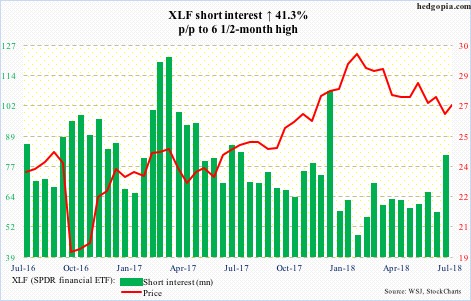
XLF ($27.05) bears hammered on $26.50-ish for over two months – unsuccessfully. During the reporting period, they took short interest to a six-and-a-half-month high. This could come in handy for the bulls if the ETF gets an earnings tailwind. Major banks and brokers report this week and next. Big picture, XLF remains below a trend line from late-January highs, which gets tested around $27.75.
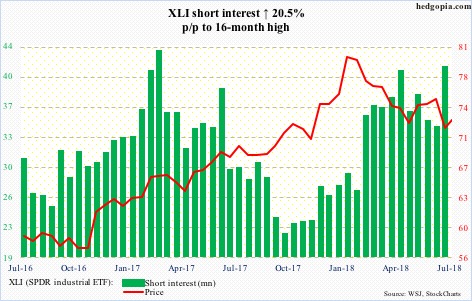
XLI ($72.52) short interest shot up 20.5 percent to a six-month high in the second half of June. Shorts were rewarded as the ETF fell 4.7 percent during the period. Still, support at $71-ish held firm. In the right circumstances for the bulls, the buildup in short interest the past five months can be a source of squeeze, but the ETF remains under a trend line from late January as well as both 50- and 200-day.
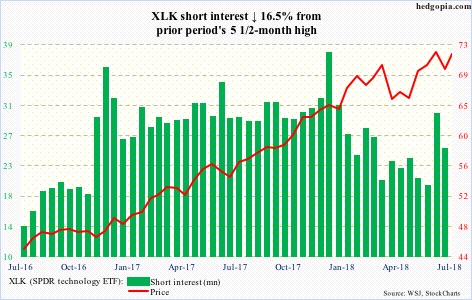
After defending $68-69 for several sessions late June, XLK ($71.49) rallied this week to within spitting distance of its all-time high of $72.43 on June 13. The daily chart is extended. Unwinding of these conditions is the path of least resistance near term.
XLP (SPDR consumer stables ETF)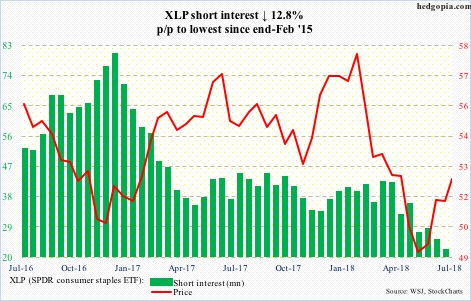
XLP ($52.47) continues to trade within an ascending channel from early May. There is stiff resistance at $52.50-53. Short interest is the lowest since February 2015. The daily chart is overbought, so unwinding of these conditions is likely. Channel support lies at $51-ish, which approximates the 50-day.
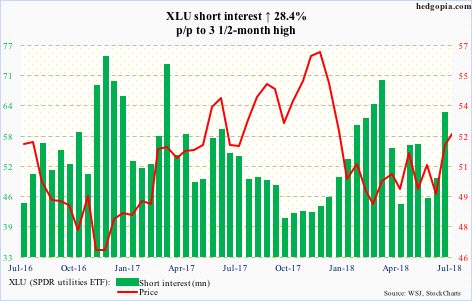
XLU (52.49) rallied intraday from $48.35 to $53.29 in 21 sessions. The latter was hit last Friday. Shorts were not too convinced of this move, as short interest rose to a three-and-a-half-month high. There is support around $52, with the 200-day at $51.76.
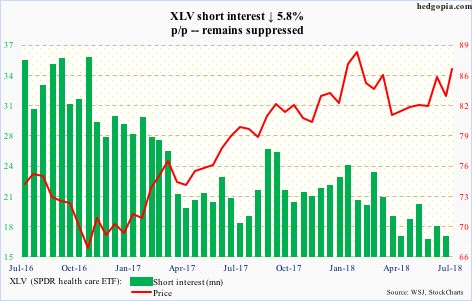
XLV ($86.28) early April breached February 9 reversal low, but has since made higher lows. A golden cross just developed. With that said, there is resistance at $87. Short interest remains suppressed, so odds of a squeeze are remote. The ETF likely wants to go lower near term.
XLY (SPDR consumer discretionary ETF)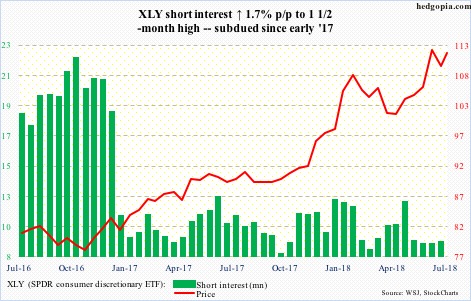
Late June, XLY ($111.60) bulls once again defended a rising trend line from early April. The rally since just about tested this week its all-time high from three weeks ago. Shorts are not in a position to help out, as they have played cautious since early 2017. The aforementioned trend line gets tested around $109.50.
Thanks for reading!

