
Here is a brief review of period-over-period change in short interest in the July 16-31 period in nine S&P 500 sectors.
XLB (SPDR materials ETF)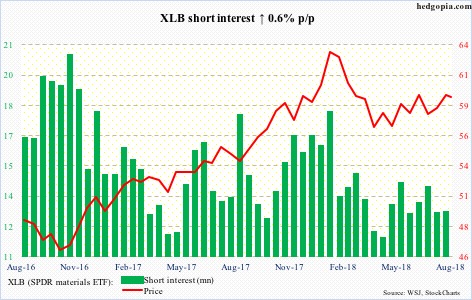
XLB ($59.54) bulls continued to defend a rising trend line from early April. At the same time, a falling trend line from late January is intact. The ETF is barely above the 200-day moving average, with just south of $60 proving tough resistance. Near term, it can go test the trend-line support again.
XLE (SPDR energy ETF)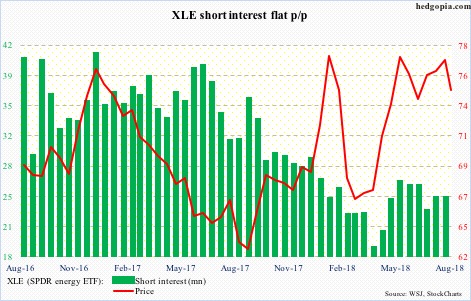
Resistance at $78-79 on XLE ($74.83) has acted as a ceiling since last December, including in the last two sessions of July. In five of the last six sessions, the 50-day repelled rally attempts. The average is gradually rolling over. There is support at $74-plus, followed by $72.50-ish.
XLF (SPDR financial ETF)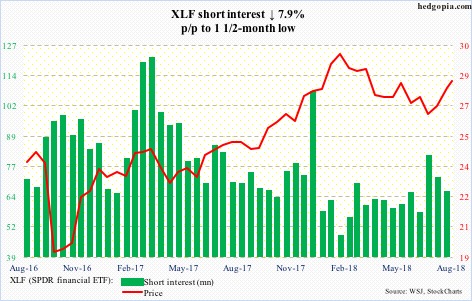
End-June, XLF ($28.30) short interest rose to a six-and-a-half-month high. That was when support at $26.50-ish was briefly breached, and, as it turns out, falsely. A rally followed, and with that a decline in short interest. Monday, the ETF tested resistance at $28.50 – unsuccessfully. Daily momentum indicators are grossly extended. The likely path of least resistance is down.
XLI (SPDR industrial ETF)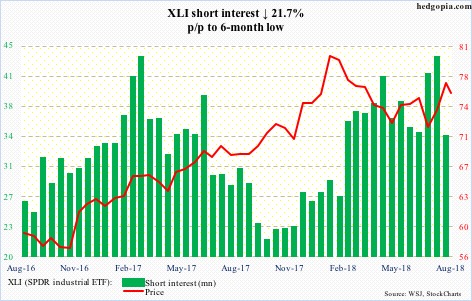
XLI ($75.74) rallied in July – squeezing the shorts – until it hit the wall on the 31st when it retreated from $76.99. For five months now, this level has provided resistance. Wednesday, a rising trend line from early July was broken, raising odds of continued pressure near term. The 200-day lies at $74.82.
XLK (SPDR technology ETF)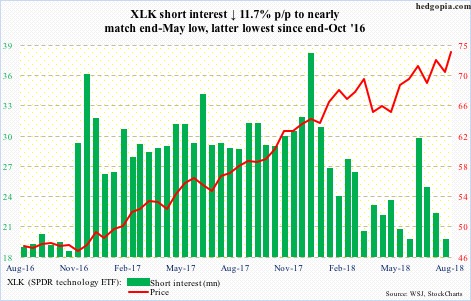
XLK ($73.62) rallied to a new all-time high of $74.24 on July 25. Wednesday, it rose to $73.90 intraday before coming under slight pressure. The high 12 sessions ago was denied at the upper end of a six-month channel. In the meantime, all the build-up in short interest post-presidential election in November 2016 is gone. Shorts that stayed put have better odds of succeeding now.
XLP (SPDR consumer staples ETF)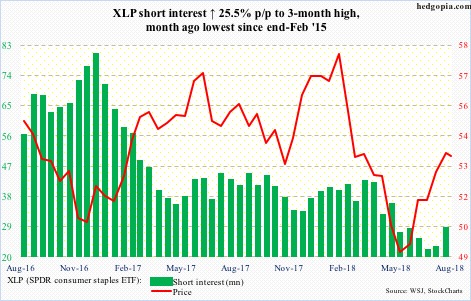
That is some rally XLP ($53.44) put up. After bottoming early May at just under $49, the ETF last week briefly even broke out of a three-month channel. It has since dropped back into the channel, closing Wednesday right on the 200-day. The 50-day lies at $52.03, which is where the bottom end of that channel lies. A test is likely.
XLU (SPDR utilities ETF)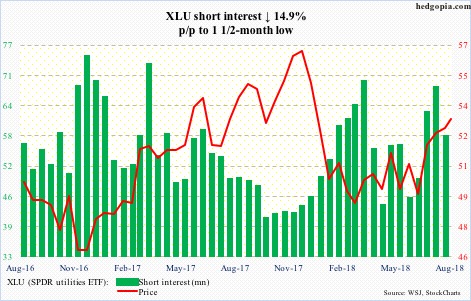
Since bottoming at north of $48 early June, XLU ($53.22) rallied strongly, only to hit the wall just north of $53 early July. Resistance has continued. Short interest is still elevated, but a squeeze increasingly looks less likely near term.
XLV (SPDR healthcare ETF)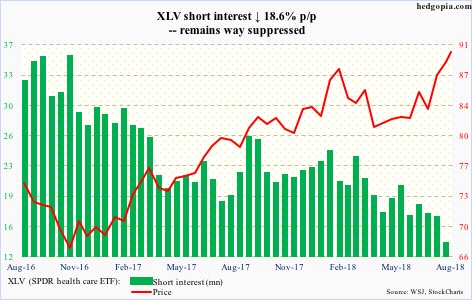
For a while now, XLV ($90.02) shorts have gotten squeezed. This continued in the second half of July. The ETF in the meantime has rallied to striking distance of its all-time high from late January – $91.79 versus $90.38 Wednesday. Daily and weekly charts are way overbought, with some signs of fatigue in recent sessions.
XLY (SPDR consumer discretionary ETF)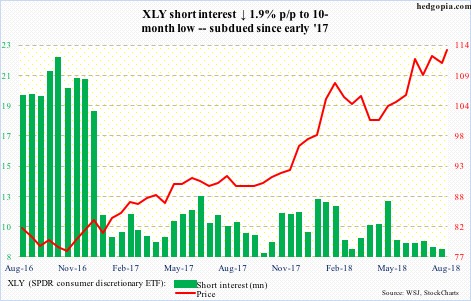
Since early 2017, XLY ($113.67) shorts have pretty much stayed on the sidelines. Rightly so. The ETF Wednesday rallied to a new intraday high of $114.07. That high also kissed the upper end of a rising channel, raising odds of a pullback.
Thanks for reading!
