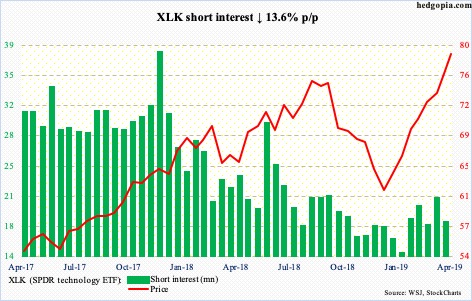
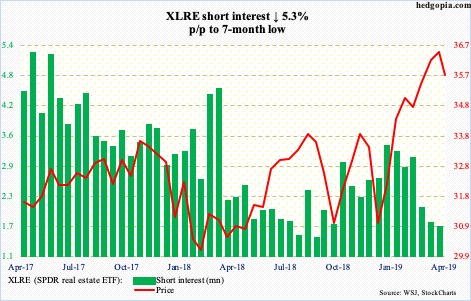
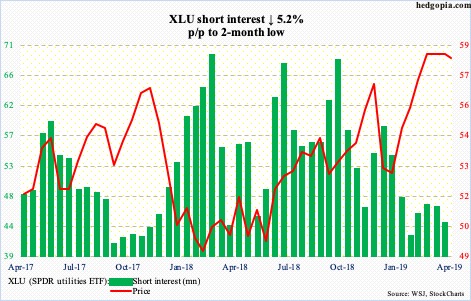
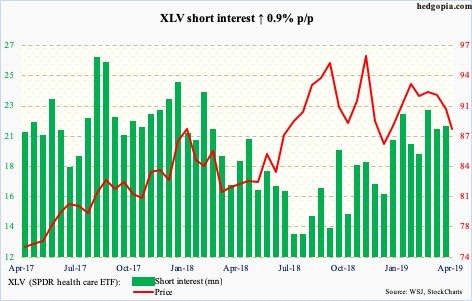
Here is a brief review of period-over-period change in short interest in the April 1-15 period in 10 S&P 500 sectors.
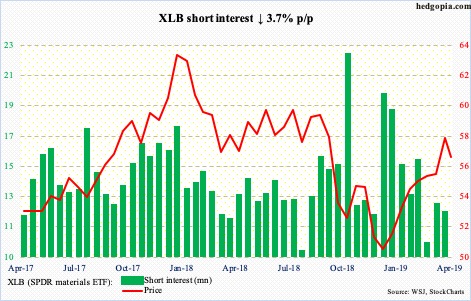
The breakout early this month just north of 56 is still intact, although a retest looks like the path of least resistance near term. The 50-day (55.99) lies right there. XLB (56.60) has come under slight pressure since printing 58.50 six sessions ago. For whatever it is worth, that was also the session in which the ETF completed a 50/200 golden cross. Shorter-term moving averages are beginning to roll over.
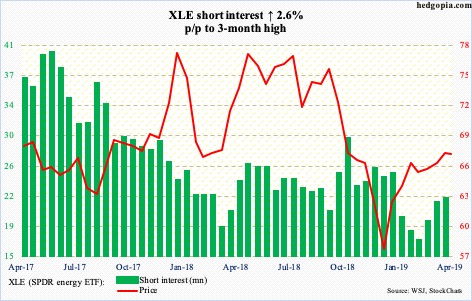
XLE (67.09) is beginning to lag WTI crude oil. Tuesday, it was rejected at the 200-day (68.46). With one session to go this week, the weekly is on the verge of forming a shooting star. There was a similar candle last week and a spinning top before that. From late December, the ETF rallied 29 percent. Fatigue is showing up. The 50-day (66.38) is right underneath. After this, there is decent support at 64.
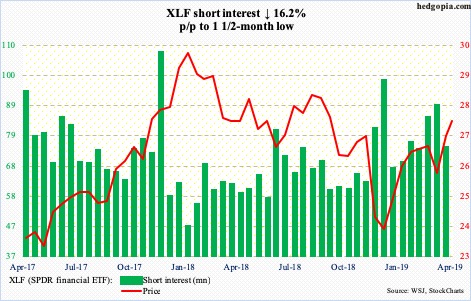
Eleven sessions ago, XLF (27.45) bulls defended the 50-day. The rally that followed quickly recaptured the 200-day, followed by a sideways move the past nine sessions around 27.50s. Even if this resistance is taken out, right above, at 27.75, lies trend-line resistance from January last year. The daily is getting extended.
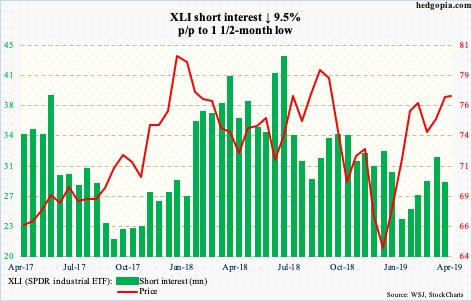
Six sessions ago, XLI (76.94) broke through 77 in what bulls would argue a cup-and-handle formation. If genuine, bulls in due course would expect the ETF to go a lot higher. But for this to transpire, they first have to take care of major resistance at 80-81. In January last year, XLI retreated from 80.96. Last September, it backed away from 80.41. The high in the latest uptrend is 78.95. The pattern of lower highs has not been broken. Thursday, it essentially closed at 77, and looks to be itching to go lower near term.
In the last 18 weeks (including this week), XLK (78.86) had only one down week. From late December, it is up 38 percent. The prior high of 76.26 from early October last year has been surpassed. As extended as the ETF is, momentum is intact, with the daily RSI at 80.14 Wednesday. Bulls have been persistently defending shorter-term averages. Until they roll over, bears will have no opening.
XLP (SPDR consumer staples ETF)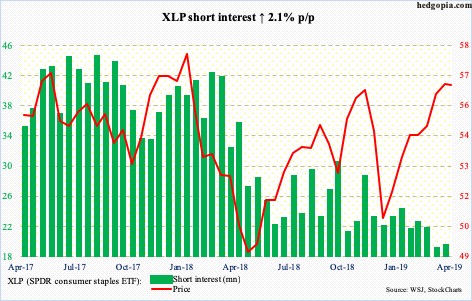
Last week, XLP (56.47) broke through trend-line resistance from January last year around 56. It then hammered on horizontal resistance at 57. To get here, the ETF has come a long way, having bottomed at 48.33 last December. A pause makes sense. Right around here lies trend-line support from last December’s low. Bears need to claim this level to get any traction.
For more than two and a half years, XLRE (35.75) played ping pong within a rectangle, with the upper bound just south of 35. It broke out last month, even though building on it proved difficult. Eight sessions ago, it began retreating after touching 36.71. The subsequent weakness saw buyers waiting at the breakout. Monday’s low was 34.83.
Early March, XLU (58.01) broke out of resistance just north of 57, before rising to a new high 59.07 later that month. Since that breakout, there have been several successful retests, including late last week and early this week. Tuesday’s low of 56.98 also kissed the daily lower Bollinger band. Immediately ahead, the daily has room to rally.
The pennant that formed on XLV (88.13) for nearly a month and a half got resolved with a breakdown 10 sessions ago. After that, both the 50- and 200-day were quickly lost. The ETF quickly dropped from 92.02 to 84.65 last Thursday. If it rallies, 88-89 is the area of interest for now.
XLY (SPDR consumer discretionary ETF)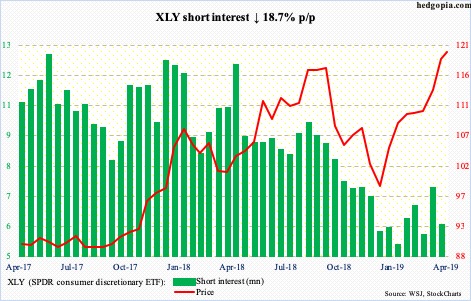
XLY (119.72) Wednesday made a fresh high of 120.90, but not before ending the session with a shooting star. Conditions – daily and weekly in particular – are extremely stretched, but bulls still carry the momentum. They just forced a breakout at 118, which they need to defend. A retest is imminent.
Thanks for reading!

