Here is a brief review of period-over-period change in short interest in the April 16-30 period in 10 S&P 500 sectors.
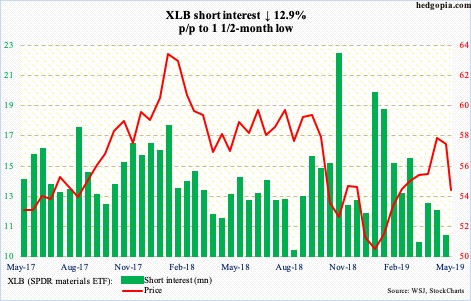
Since peaking on April 17 at 58.50, XLB (54.40) has been down for four straight weeks (including this week). This preceded a breakout at 56 early last month, which was unsuccessfully retested this week. Bulls also lost both the 50- and 200-day moving averages. Thus far, the mid-April golden cross has not amounted to much. The daily is getting oversold, but weekly overbought conditions have tons of room to continue lower. Near term, 54 has decent support, which was tested Thursday.
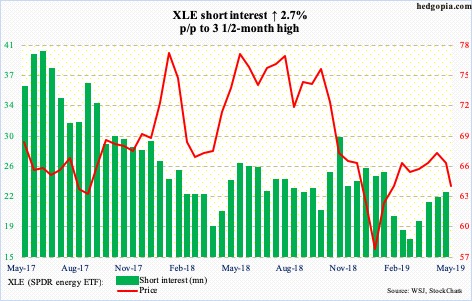
XLE (63.75) came under pressure after it was rejected at 68.81 just above the 200-day on April 23. Thursday, it printed an intraday low of 62.91. Major averages are all pointing down. Possibility of relief near term notwithstanding, there is plenty of room for continued unwinding of overbought weekly conditions.
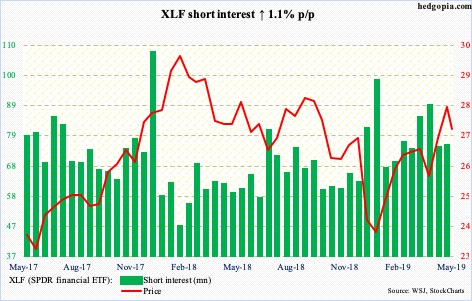
Mid-January, XLF (27.30) broke out of important resistance at 25, followed by a successful retest late March. The rally that followed peaked seven sessions ago at 28.14. Near term, shorts are likely to get active at 27.50s. Both the 50- and 200-day lie underneath (26.73 and 26.64, respectively), which might just act like a magnet near term. Thursday’s low was 26.90.
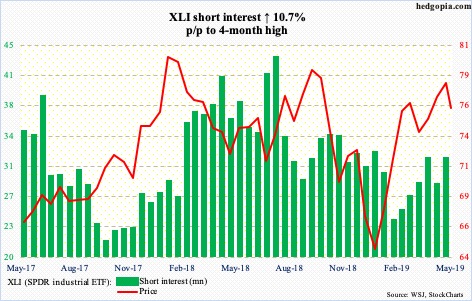
Late January last year, XLI (75.97) retreated after tagging 80.96. After that, it made two other important lower highs – 80.41 on September 20 and 78.95 on April 24. Trend-line support from the low of December is now gone. The bull-bear duel the past few sessions around the 50-day (76.01) is still undecided. The 200-day rests at 73.70.
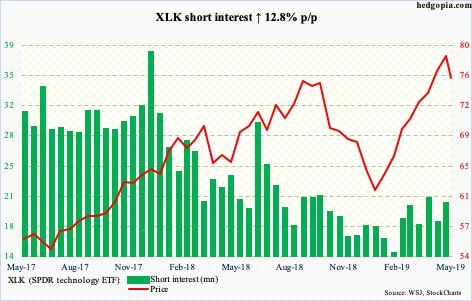
Prior to this week, XLK (75.94) had only one down week in 19. With one session to go, it is down 3.7 percent this week. This followed a spinning top last week, when it also recorded a new intraday high of 79.70 – well past last October’s high of 76.26. After having lost that support, bulls also lost the 50-day (75.03) intraday Thursday but by close the average was defended. They cannot afford to lose this.
XLP (SPDR consumer staples ETF)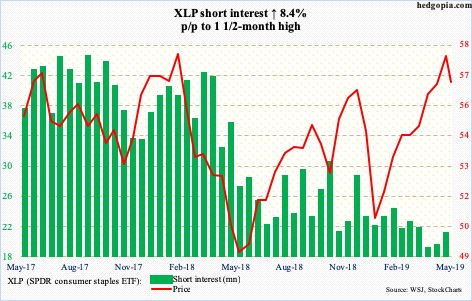
In January last year, XLP (56.62) made a new all-time high of 58.95; just under 58 lies important resistance. Early this month, this is where the ETF met with selling pressure. Near term, there is support just north of 56, which was defended Thursday. Then comes the 50-day at 55.70. Medium term, however, selling pressure should continue. A trend line from last December has been lost.
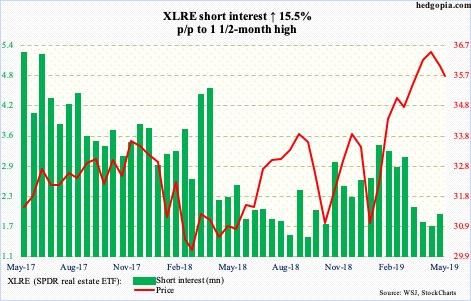
For more than two and a half years, XLRE (35.70) was rangebound within a rectangle, with the upper bound just south of 35. It broke out in February. A successful retest took place in April. The ETF has come under pressure since posting a new high of 36.71 mid-April, but bulls should be fine as long as the breakout remains valid, although risks are rising of a failed retest.
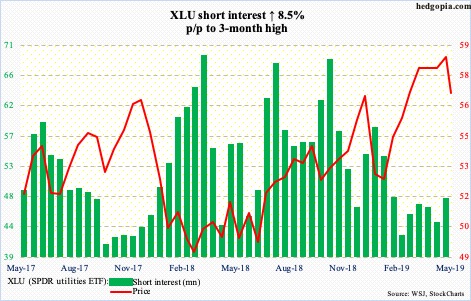
Early March, XLU (56.94) broke through stiff resistance just north of 57. Following this, bulls could only rally the ETF to 59.07 later that month. Since then, that support was successfully tested several times, until Thursday when it gave way, albeit not by much.
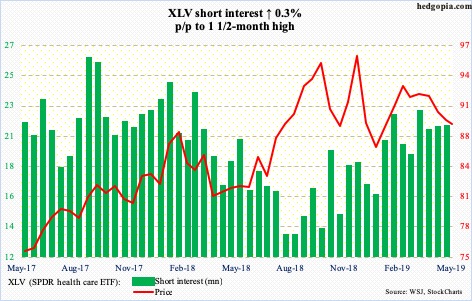
XLV (88.88) is at an interesting spot. Since the latter months of last year, it has made lower highs as well as higher lows. It is currently below both the 50- and 200-day, with bears using these averages to go short both Monday and Tuesday. There is room for downside pressure near term.
XLY (SPDR consumer discretionary ETF)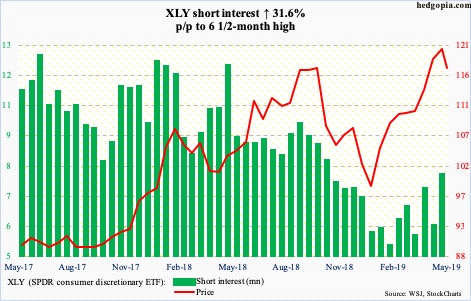
Twelve sessions ago, XLY (117.12) retreated after rising to a new intraday high of 120.90. The following week, a weekly hanging man showed up. Week-to-date, it is down 2.5 percent. The 50-day (115.27) is within striking distance. A test looks imminent near term. In fact, Thursday it dropped to 115.78 intraday before bids showed up.
Thanks for reading!

