
- Major U.S. indices have lost October 2014 trendline
- Other medium- to longer-term trendlines and support zones are intact
- Since trendline break is not in isolation, rather across indices, worth paying attention to
Five weeks ago, the S&P 500 Index (2094.11) failed to find support at an important trendline (blue arrow in Chart 1). For reference, between September 19 and October 15 last year, the index nearly lost 10 percent, before reversing higher. Hindsight is 20/20, but turns out it was an important bottom. Subsequently, there have been several other pullbacks, with buyers showing up at/near a trendline draw from that bottom.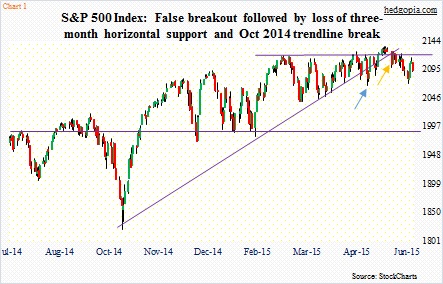
So when that support failed to hold, traders wondered if it was a trend change, or the beginning of one. On a monthly chart, there was already a bearish MACD crossover on the S&P 500. However, that breakdown proved fleeting – and false. Bulls quickly regrouped to not only retake that but in the middle of May pushed the index through three-month resistance. Once again, it proved false – this time a false breakout. The subsequent drop has dealt the index a double blow: Loss of both horizontal support and the trendline (orange arrow in Chart 1).
Trendlines are one of the oldest technical indicators. For non-believers, they are nothing but a bunch of mumbo-jumbo. For believers, it is a way to measure supply-demand dynamics.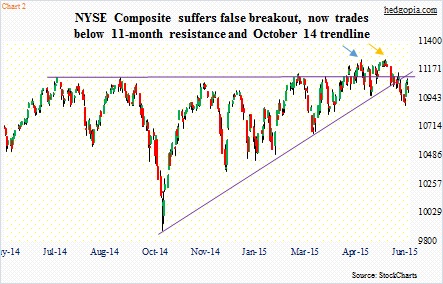
On the S&P 500, the latest trendline break has taken on importance in that it is getting confirmed by several other major U.S. indices. Five weeks ago, when it suffered a false breakdown, things were just fine on the NYSE Composite (11009.91). Late April, the NYSE broke out of resistance, only to peak shortly thereafter (blue arrow in Chart 2). The subsequent decline found support at the October 2014 trendline; this was when the S&P 500 suffered its false breakdown. The NYSE broke out again – once again falsely (orange arrow). With this, there is now dual resistance in place – the broken trendline and 11-month horizontal resistance.
To be clear, the prevailing deterioration on an index level does not hold true across sectors and industries. For instance, both KRE, the SPDR KBW Regional Banking Index ETF, and KBE, the SPDR KBW Bank Index ETF, which is 78 percent regional banks, have broken out. XLF, the SPDR Financial Sector ETF, which assigns bigger weights to large financials, is yet to break out of six-month consolidation. Transports, on the other hand, have badly broken down. Even within transports, some groups are faring better than others.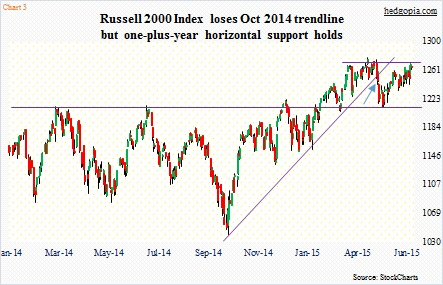
Speaking of some doing better than others, on an index level, RUT, the Russell 2000 Small Cap Index (1265.02), comes to mind. As far as the October 2014 trendline is concerned, the Russell 2000 lost it earlier than either the S&P 500 did or the NYSE (blue arrow in Chart 3). But the damage was contained as it found support on one-plus-year horizontal support. For nearly two months now, it has gone flat. Bulls for sure are hoping for a breakout. In and of itself, the Russell 2000 of late has shown encouraging action, but probably will not remain immune to deterioration in other indices.
And that is the risk. The October 2014 trendline has now been broken on all major U.S. indices.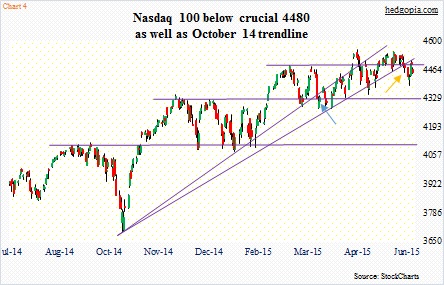
On the Nasdaq 100 (4453.79), unlike other indices, two trendlines can be drawn from the October 2014 low. It can be argued that it lost that trendline as early as late March (blue arrow in Chart 4). After that break, throwback rallies were consistently rejected. The second trendline stopped pullbacks until two weeks ago when it lost both the trendline and 4480 (orange arrow). The latter is proving to be crucial. The index first broke out of it toward the end of April but could not sustain the momentum. It broke out again mid-May, and once again, the breakout proved fleeting.
Over on the Dow Industries (17898.84), the story is the same. The October 2014 trendline is gone (Chart 5). There was a false breakdown five weeks ago, followed by a quick recapture. But it is lost again.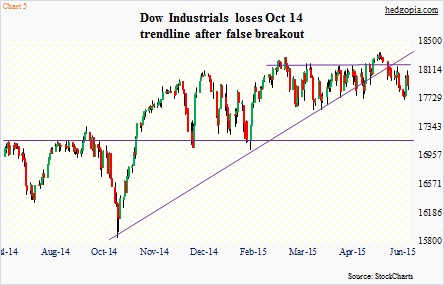
As things stand now, loss of the October trendline has not taken place in isolation. All the five indices above have broken down. It should be emphasized that this is a shorter-term trendline. Medium- to longer-term trendlines or support zones are just fine. With that said, a trendline break as widespread as it is is worth paying attention to.
Thanks for reading!
