
Under pressure in recent weeks, major US equity indices ended last week right on support. In a seasonally favorable period, virtually no one thinks the latest decline can – and will – turn nasty. For that not to happen, bulls need to hurry up and step up to the plate.
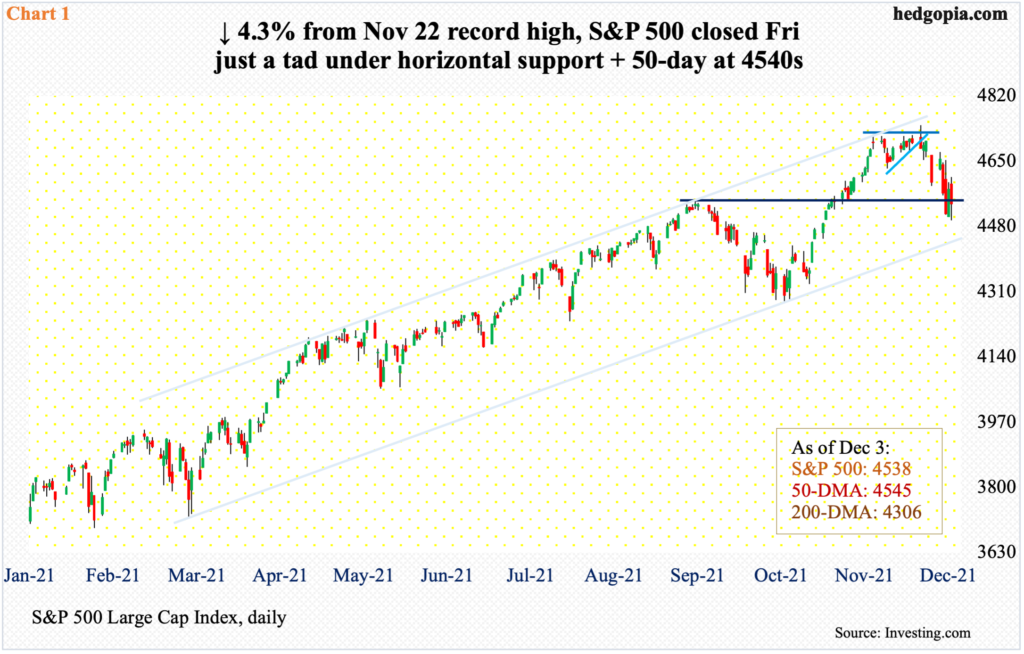
The S&P 500 is caught within a months-long ascending channel. On November 5, when it rose to 4719, it kissed the upper end and retreated. On the 22nd, the large cap index rallied to a fresh intraday high of 4744 but only to reverse hard to close in the red. From that high through last Friday’s low of 4495, it dropped 5.2 percent, which is not a whole lot in the big scheme of things. The index closed last week just below horizontal support plus the 50-day moving average at 4540s, having rallied 30 handles in the last 10 minutes on Friday.
Earlier, November ended with a monthly shooting star. This was preceded by a bearish outside month in September, which was immediately negated by October’s bullish outside month. December’s candle, therefore, can have important implications.
Inability to save 4540s exposes the S&P 500 to risks of 4460s, which is where channel support lies (Chart 1). The 200-day is at 4306. In the event of a rally, immediate resistance lies at 4650s, where bears can show up.
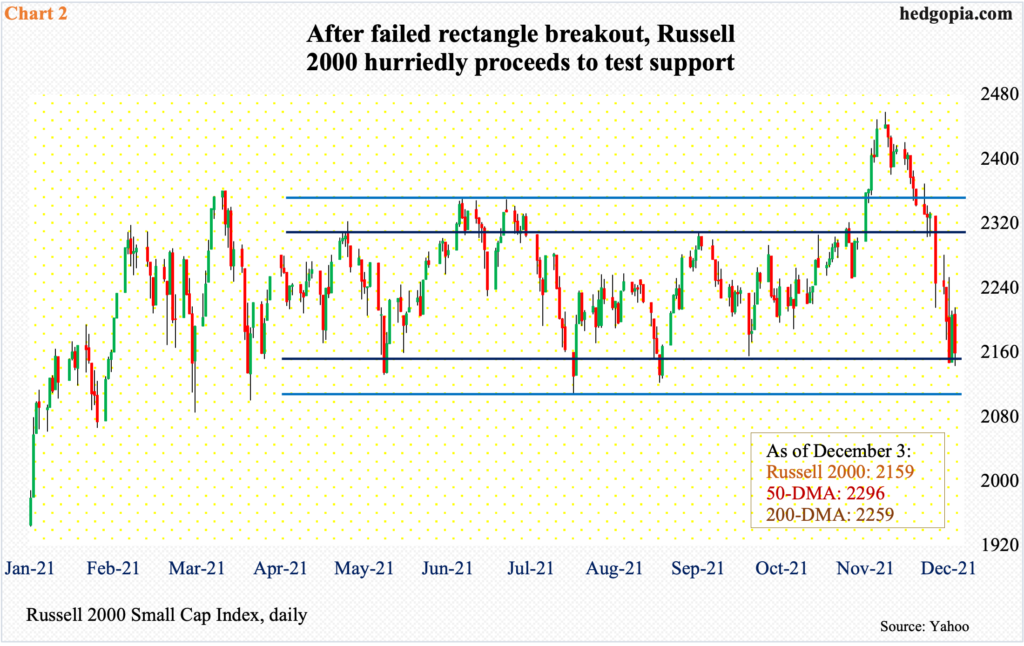
Small-caps are faring worse. The Russell 2000 peaked earlier – on the 8th. From that high through last Friday’s low, it shed 12.9 percent. In three consecutive sessions through Friday, bulls showed up at 2140s, closing out the week at 2159.
For nearly nine months now, the small cap index has been rangebound between 2350s and 2080s, and between 2280s and 2150s within this box. On Nov 3, it broke out, followed by a failed retest on the 19th (Chart 2).
A loss of 2150s can result in a hurried test of the lower end of the rectangle the Russell 2000 finds itself in. Otherwise, the daily is oversold and can rally. The 200-day lies at 2259. Just above that lies 2280s resistance.
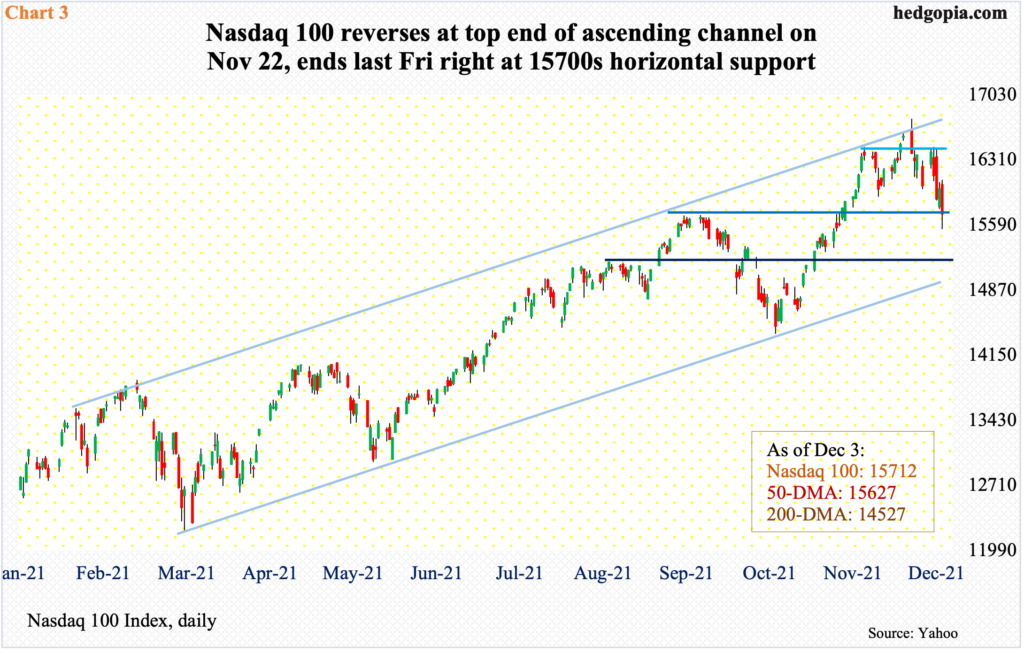
The story evolved similarly on the Nasdaq 100.
After September’s bearish outside month and October’s bullish outside month, November ended with a shooting star. December has just begun; at last Friday’s low, it was down as much as 3.7 percent for the month but a 170-point rally in the last hour helped cut the losses to down 2.6 percent, ending right at 15700s support (Chart 3).
Earlier on Nov 22 when the Nasdaq 100 rallied to a fresh intraday high of 15765, sellers showed up in droves right at the top end of a months-long ascending channel. Last week, the index also broke the neckline of a head-and-shoulders pattern, which would have completed at 15500s. On Friday, the index dropped to 15543 intraday – past its 50-day – but rallied to close the session at 15712, reclaiming the average.
A breach of 15700s raises the odds it heads toward 15100s, which, incidentally, is where channel support lies.
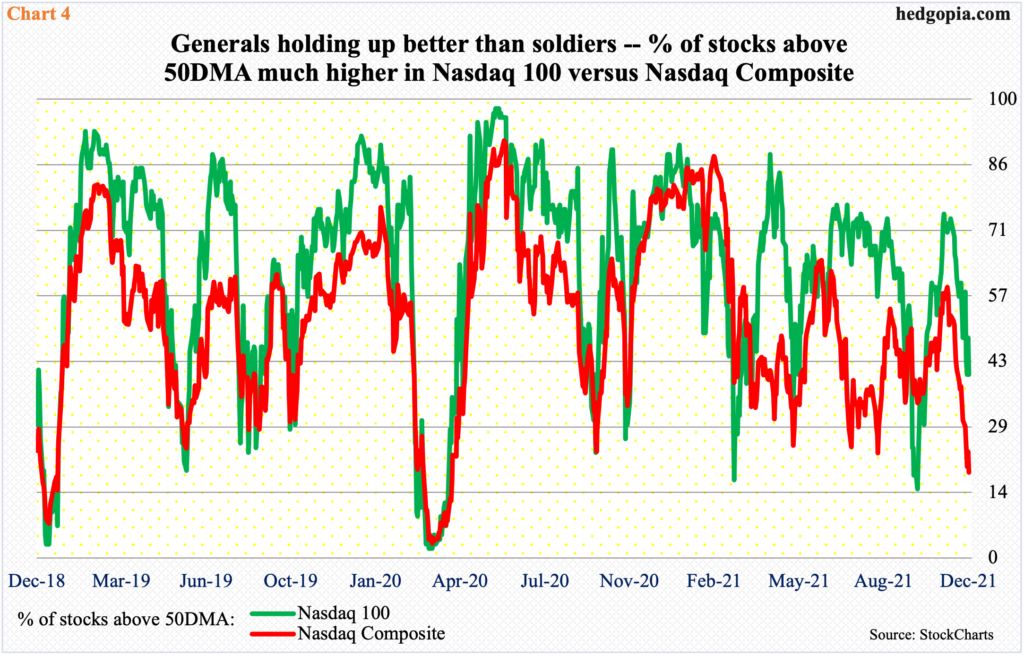
As things stand, action is top-heavy. The generals are holding up better than the soldiers.
Last Friday, only 18.6 percent of Nasdaq stocks were above their 50-day. This was the lowest reading since April last year. Back then, it dipped as low as 3.2 percent in March. This time around, the metric already reached here with the index only down seven percent from its November 22 high; the 50-day has been breached. The last time the red line in Chart 4 was this low, the index was recovering from a five-week, 33-percent collapse in February-March last year.
In contrast, 40 percent of Nasdaq 100 stocks were above their 50-day last Friday. During a one-month, 8.4-percent decline through October this year, this metric dropped as low as 15 percent. This time around, through Friday’s low, the index declined 7.2 percent.
The point is, bulls are not letting go of their big-cap tech, which, depending on how things shake out in the sessions/weeks ahead, could both make or mar the seasonality factor. Inability to defend the aforementioned support can quickly unravel bulls’ patience.

Speaking of which non-commercials are heavily leaning bullish in both e-mini S&P 500 and Nasdaq 100 index (mini) futures (Chart 5). As of last Tuesday, they were sitting on 179,725 and 33,933 net longs, which were the highest since December 2018 and January this year, in that order.
The buildup in S&P futures is particularly conspicuous. In the latter months of 2018, longs began to cut back from similar, or slightly higher, levels (longer-term chart here). That is the crux of the issue right now. If things do not pan out the way they expect soon, the urge to close out their positions can rise. Right here and now, things are fluid, hence the significance of the need to hold support.
Thanks for reading!
