
There is confusion in the markets. Several times this month, bulls tried to take momentum by the horns, but only to get gored, including last Friday. Bears have not had a smooth ride either. Amidst this back-and-forth action, major US equity indices ended last week right at/near major support. A breach is possible, as is the possibility of a reversal for a quick trade.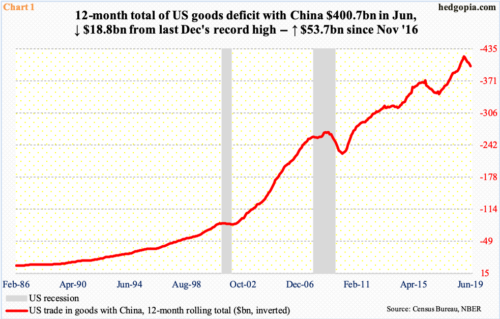
Chart 1 is front and center in the ongoing trade tension between the US and China. The latter runs a huge surplus with the former. In 2018, US goods deficit with China rose to $419.5 billion – a record. Since then, it has dropped a bit, with the 12-month total coming in at $400.7 billion in June.
Since Donald Trump was elected president in November 2016, US deficit with China has gone up by $53.7 billion. The White House considers the trade imbalance unfair. During the presidential campaign, Mr. Trump advocated imposing tariffs to rectify this, which he followed up with in March last year. China quickly responded with its own tariffs on US goods. Since then, there have been several tit-for-tat moves.
Last Friday, the showdown likely took a nasty turn. China announced a new round of retaliatory tariffs on $75 billion of US goods effective September 1 and December 15. Within hours, the US hit back, raising the existing tariffs on $250 billion of Chinese goods from 25 percent to 30 percent effective October 1 and from 10 percent to 15 percent on the remaining $300 billion worth effective December 15. In other words, the standoff between the world’s two largest economies just went up a notch or two. Markets were thrown a curve ball.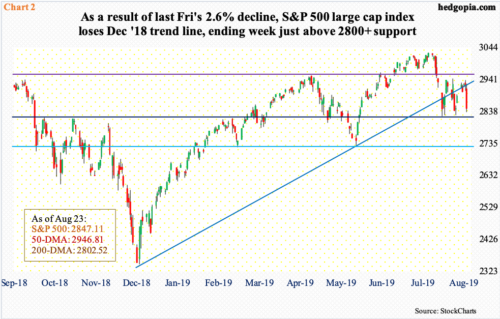
There was already a lot of confusion in the markets to begin with.
On the NYSE, down volume surpassed up volume by nine to one last Friday. In fact, over the last 15 sessions – that is three trading weeks – there were two more sessions where down volume simply eclipsed up volume – one with a ratio of 11 and the other with 19. These are massive distribution days. Before one uses this data point to conclude that institutions are bailing out, consider this. Over that same three-week period, there were two big accumulation sessions, in which up volume exceeded down volume by a significant margin, with a ratio of six and eight. Both bulls and bears lack conviction at this moment.
Let us take action on the S&P 500 large cap index as an example. In seven sessions between 3027.98 on July 26 to a low of 2822.12 on August 5, it quickly shed 6.8 percent. This was then followed by a quick 4.3-percent rally in six sessions, retreating after touching 2943.31 on the 13th. Bulls aggressively defended support just north of 2800, even as bears showed up at the 50-day moving average.
Plus, the index last September tagged 2940.91 right before the October-December onslaught. After bottoming late December, it rallied strongly but only to witness sellers show up late April at 2940s-50s. This has also been the case the past three weeks; last Thursday, the S&P 500 pulled back after tagging 2939.08. With Friday’s 2.6-percent rout, the index (2847.11) once again sits near the aforementioned support (Chart 2). The 200-day lies at 2802.52. A test of this support zone looks imminent this week.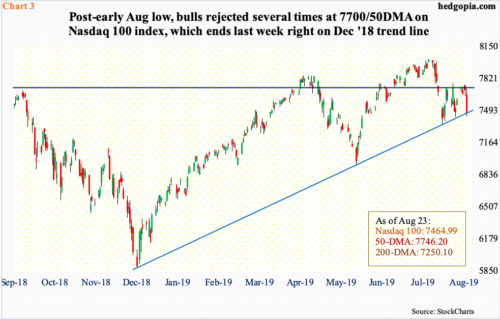
Things evolved similarly on the Nasdaq 100 index. August has seen a lot of back-and-forth. The index (7464.99) peaked at 8027.18 on July 26, bottomed at 7356.27 on August 5 and then peaked again at 7778.34 on the 13th. Since that high, one-year horizontal resistance at 7700 has been tested several times – all unsuccessfully. The 50-day (7746.20) lies there as well.
Last week, sellers showed up at that resistance in all of the first four sessions, with a long-legged doji forming right underneath that average on Monday and Wednesday. Friday’s 3.2-percent collapse put the index right on trend-line support from last December, which bulls defended a few times in the prior two weeks (Chart 3).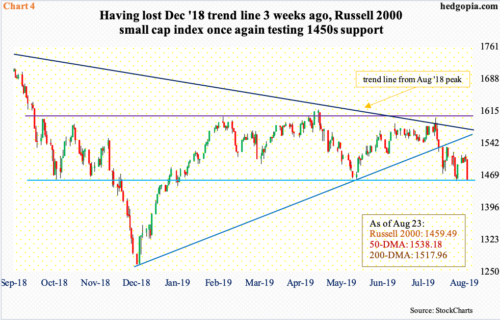
That same trend line has been breached on a closing basis on both the S&P 500 and the Russell 2000 small cap index – last Friday on the former and early August on the latter. On the S&P 500, the December trend line was lost intraday in the prior two weeks also but only to get recaptured by close. Last week was different. On the Russell 2000, the trend line was lost three weeks ago and has not been recaptured since.
Even though the December trend line was lost, small-cap bulls mid-August stepped up to defend two-year horizontal support at 1450s. The rally since ran into trouble at the 200-day (1517.96), including last Thursday. This was followed by Friday’s 3.1-percent smackdown. Once again, the Russell 2000 (1459.49) is clinging on to support at 1450s (Chart 4).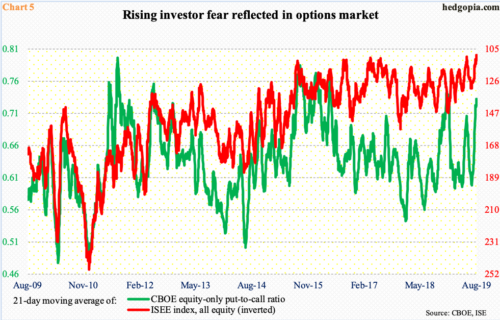
Perhaps importantly, the Russell 2000 is below both its 50- and 200-day. The other two indices above, as well as the Dow Industrial Average, remain sandwiched between the two averages. As a matter of fact, thanks to Friday’s 2.4-percent decline, the Dow essentially sits on the 200-day. On the S&P 500, it is 1.6 percent away, and on the Nasdaq 100 2.9 percent away. A test of the average looks imminent this week.
On both the daily and weekly, there is room for continued unwinding of overbought condition. A failure to hold the 200-day would also mean the S&P 500 would have lost 2800+ and the Nasdaq 100 its December 2018 trend line.
Then, there is Chart 5, which plots the 21-day moving average of the CBOE equity-only put-to-call ratio and the ISEE index. The latter is a call-to-put ratio, hence inverted. Currently, both show a gradual buildup in fear over the past month. In fact, last Friday the red line, at 108.9, was the lowest ever, while the green line, at 0.733, was the highest since last December. Back then, the green line peaked on Christmas Eve at 0.744, which is pretty elevated, although in 2015-16 it rose even higher. But, if past is prologue, unwinding from these levels is just a matter of when, not if.
This suggests that the possibility of a reversal for a quick relief rally is always there. There has been a couple already this month. If the S&P 500, for instance, breaks the 200-day, taking out stops, one possible spot where bids can show up is the lows of early June (Chart 2). By that time, the index would have dropped 10 percent from the late-July high.
Thanks for reading!
