
Unless a coronavirus vaccine is miraculously developed at record time, a V-shaped recovery in the economy is not probable. Yet, stocks seem to be anticipating one. The Fed is flooding the system with liquidity. Stocks have rallied massively off of the lows of three weeks ago and have approached crucial resistance. Bears are likely to get active.
The U.S. economy came to a screeching halt in March – the second half in particular. Among others, unemployment claims soared to record levels, with nearly 17 million Americans filing for new claims for benefits since mid-March. The wrath of the coronavirus is permeating every nook and cranny of the society.
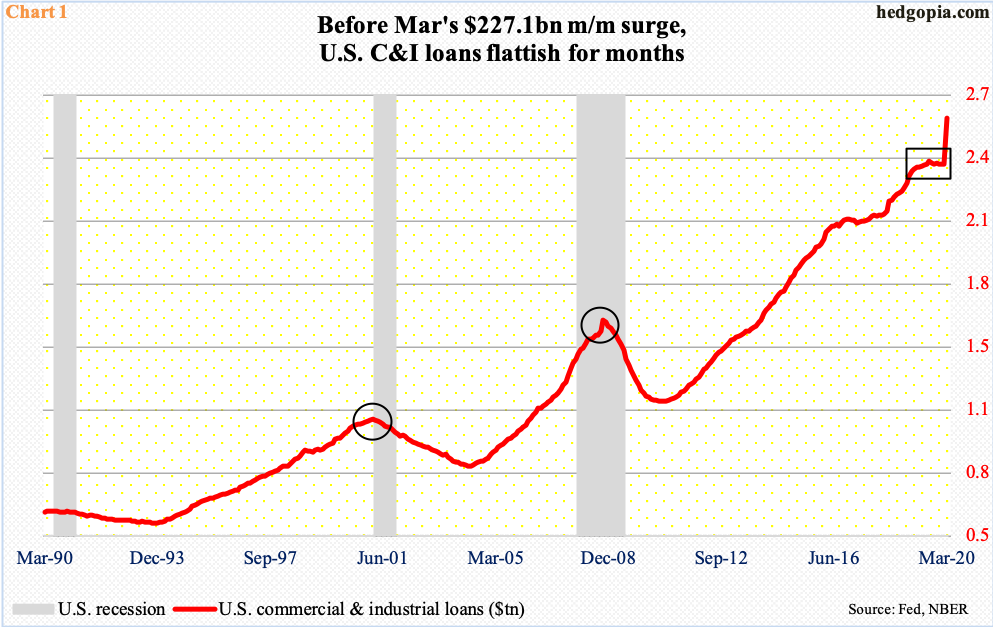
Yet, U.S. banks’ commercial & industrial loans jumped $227.1 billion in March over February, to $2.59 trillion – a new record (Chart 1). This was the largest month-over-month advance going back to 1947. This is counterintuitive.
In past recessions, C&I loans tended to unwind the excesses of the prior expansion. This time around, they seem to be going the other way. They surged because companies rushed to build up cash reserves. The loans were not taken out for project expansion or capital expenditures. Rather, thanks to the virus-spurred panic, credit lines were drawn – just in case.
As a matter of fact, prior to March, C&I loans had been flattish for months. If past is prelude, they will eventually head downward – unless the U.S. economy is primed for a V-shaped recovery. Stocks, which have rallied massively off the lows from three weeks ago, seem to be pricing in that very outcome. But they have also rallied because of the Fed, which has aggressively expanded its balance sheet, broadening its reach into all kinds of assets.
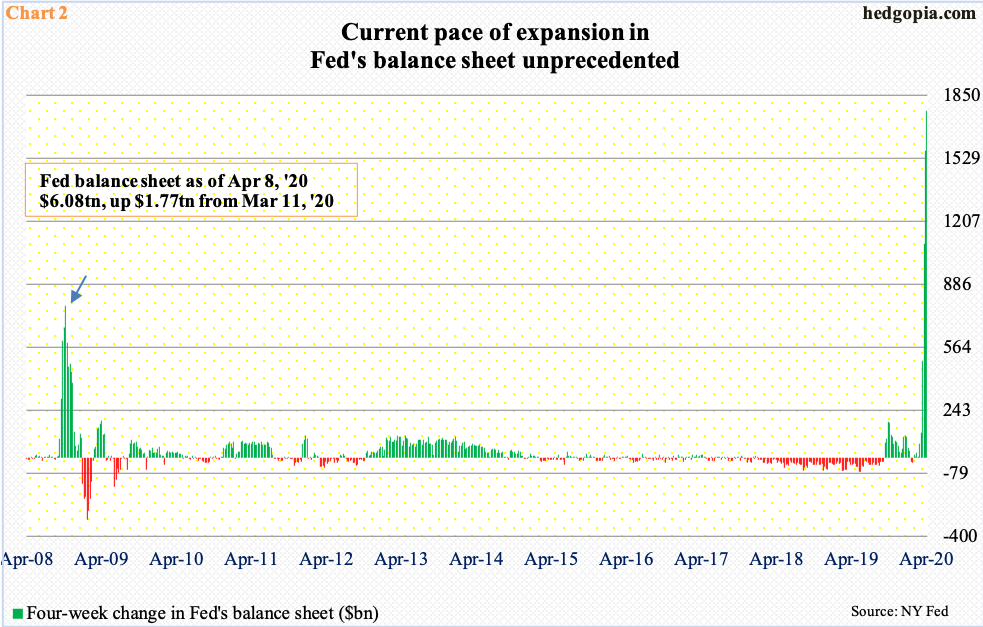
During and well after the financial crisis of 2007-2008, the Fed purchased Treasury securities and mortgage-backed securities. By January 2015, its balance sheet had ballooned to $4.52 trillion, before dropping to $3.76 trillion by last August. From that low, it then expanded $2.32 trillion in less than eight months. In just the past six weeks, it went up $1.92 trillion, to $6.08 trillion. The current pace of asset purchases simply dwarfs what was witnessed during the financial crisis (arrow in Chart 2).
On March 15th this year, the Fed ventured into investment-grade corporate bonds, and into junk and municipal debt last week. It can now buy junk debt.
Increasingly, it feels like it is just a matter of time before the Fed begins buying equities. As a matter of fact, Janet Yellen, Chair Jerome Powell’s predecessor, kind of tested the waters last Monday, saying the Fed currently is not in a position where it needs to buy equities but that lawmakers should give it more leeway for the future. Major U.S. stock indices had a very good week last week, with the S&P 500 large cap index rallying 12.1 percent and the Russell 2000 small cap index one-upping its large-cap cousin with an 18.5 percent surge.
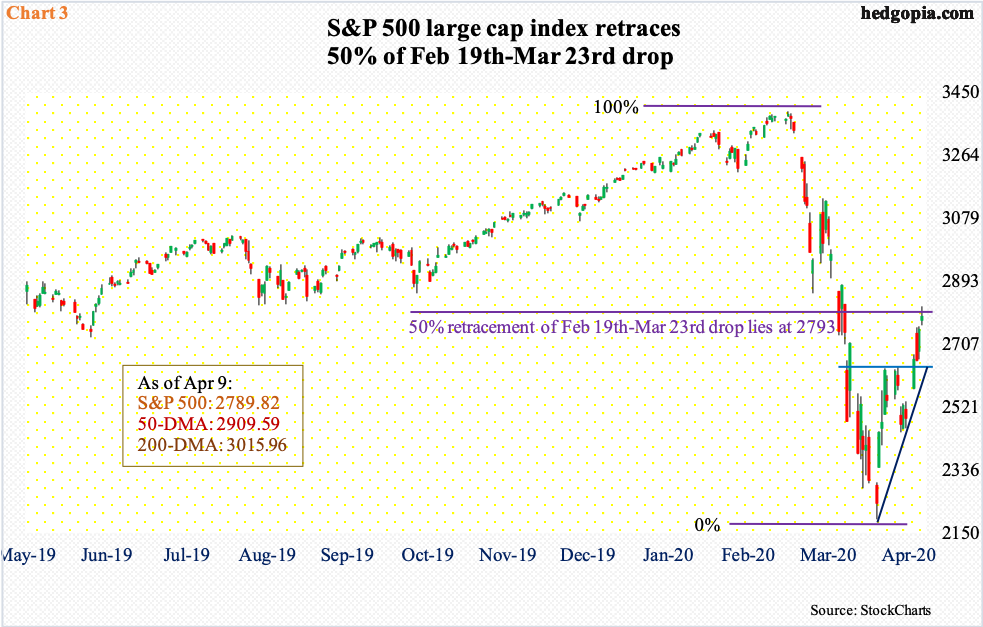
In merely three weeks, stocks have come a long way. From the March 23rd low through last Thursday’s high, the S&P 500 (2789.82) jumped 28.6 percent intraday. It is still below both its 50- and 200-day moving averages, which are respectively 3.2 percent and seven percent away – shows the damage wrought by the collapse post-February 19th peak.
Thursday’s intraday high of 2818.57 ran into horizontal resistance at 2800-2850, which goes back a couple of years. This level also approximates a 50-percent retracement of the February 19th-March 23rd collapse (Chart 3).
The daily is now extended, and this is a perfect spot for bears to press their luck. A rising trend line from March’s low draws to 2630s. This is also where bulls faced difficulty several times last month. A decent bull-bear duel could be shaping up around this price point.
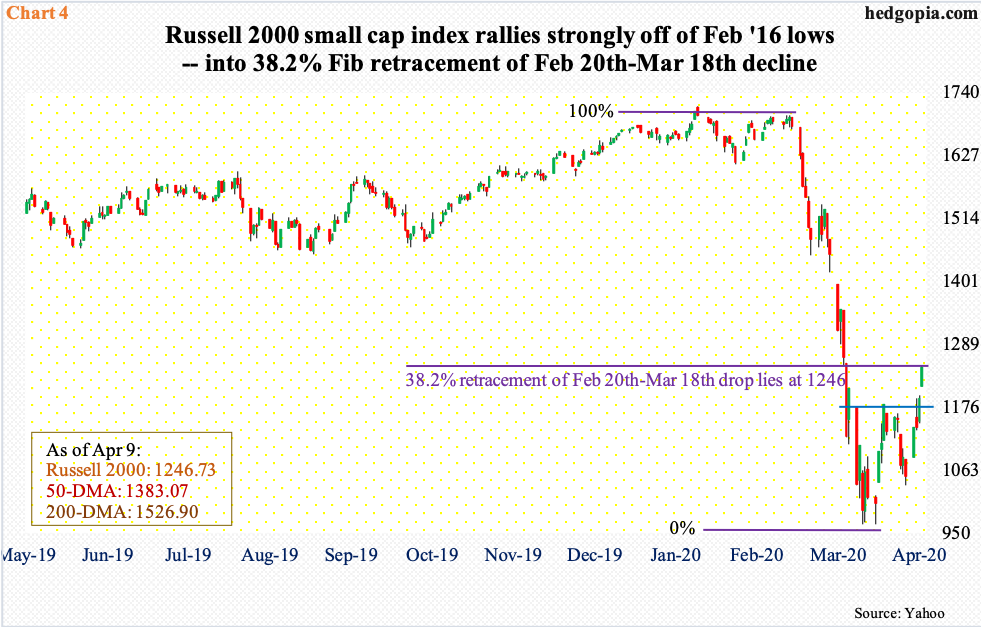
The Russell 2000 (1246.73)), too, has reached an important retracement point of the recent collapse. A 38.2-percent Fibonacci retracement of the February 20th-March 18th drop lies at 1246 (Chart 4). This is where the index closed last Thursday. Around 1250s also rests five-year horizontal resistance.
For a while now, small-caps had been severely lagging large-caps. This changed last week, with the Russell 2000 gaining 18.5 percent versus 12.1 percent for the S&P 500. It is too soon to declare that a new trend has begun, if it is, then risk-on will gain momentum.
For now, a breather makes perfect sense. There is decent support at 1160s.
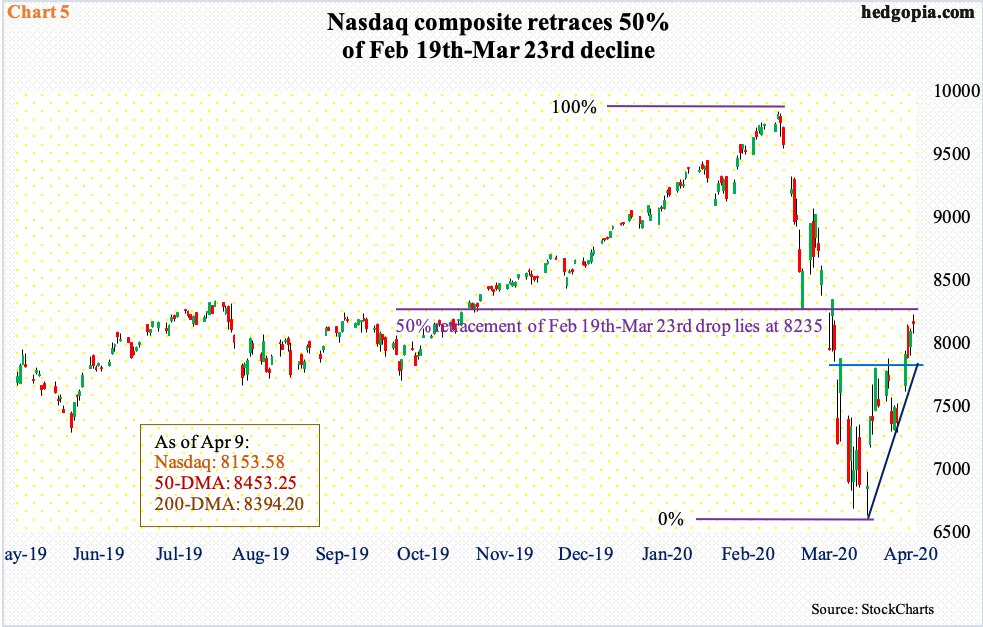
Speaking of a breather, the Nasdaq composite (8153.58) last Thursday formed a spinning top after a massive rally off of its March 23rd low. As it turns out, that session formed a spinning top as well, which marked the beginning of a reversal to the upside (Chart 5). Last Thursday’s spinning top could mark a reversal to the downside. The intraday high of 8227.91 in that session just about retraced 50 percent of the February 19th-March 23rd decline. This is as good a spot as any for bears to begin to prowl.
Down below, there is short-term horizontal support at 7800, which is where a rising trend line from last month’s low extends to.
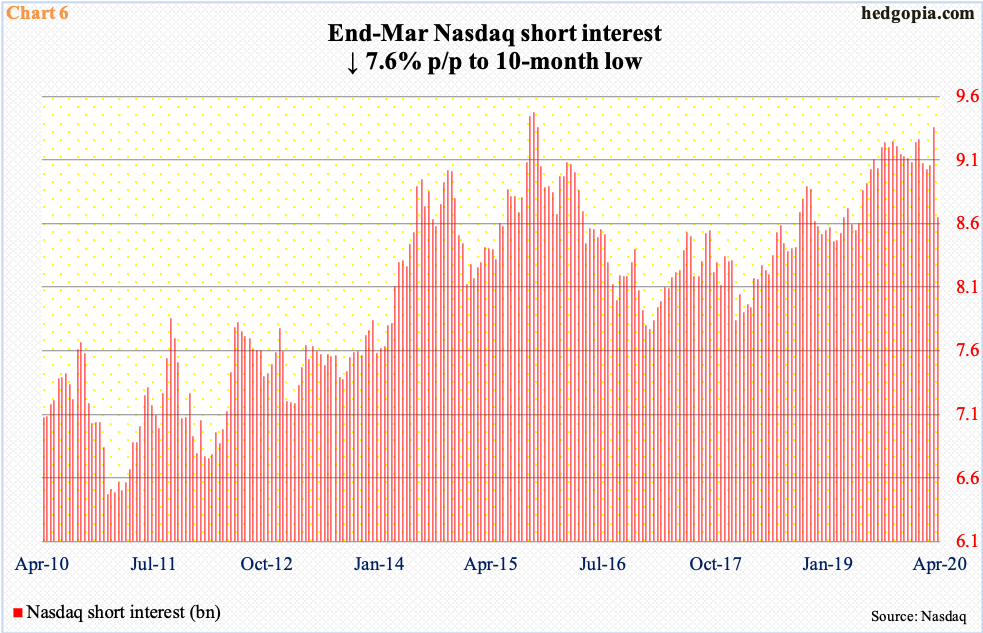
In March, shorts fared very well. In the latter half of the month, the Nasdaq dropped 2.2 percent, and was down as much as 15.8 percent at the lows. Shorts likely used that as an opportunity to lock in profit. End-March short interest fell 7.6 percent period-over-period to 8.6 billion shares. This was a ten-month low (Chart 6).
In the big picture, short interest is still elevated. April-to-date, the index is up 5.9 percent. It is possible more shorts covered – or got squeezed. The thing is, each drop in short interest also amounts to lesser fuel for squeeze, particularly so as the index currently sits at important resistance. Bulls have used up lots of energy in rallying the index to where it sits currently. Odds favor shorts once again get active here.
Bear call spreads probably make sense. Hypothetically, a May 1st QQQ 209/212 credit call spread – short 209 for $3.66 and long 212 for $2.59 – fetches $1.07. It is a three-point spread, hence $1.93 is at risk. QQQ (Invesco QQQ Trust) ended last week at $200.86. The trade begins to bleed if the ETF rallies 4.6 percent from that close.
Thanks for reading!
