
The major US equity indices closed last week either right on or in slight breach of trendline support from last October’s low. Bulls’ mettle is being tested, even as investor sentiment remains too giddy.
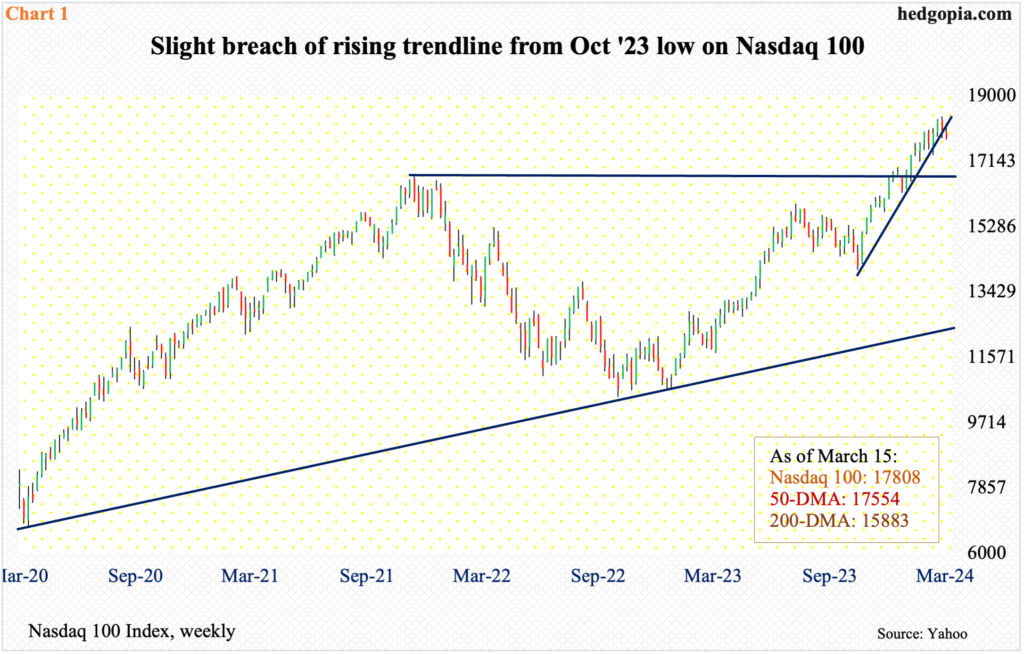
The Nasdaq 100 ended the week before on a rising trendline from last October’s low. In the early goings last week, tech bulls were clearly not in a mood to lose this support. Both Monday and Tuesday, bids were waiting at the 20-day moving average, with Tuesday ticking 18228. On the prior Friday, the tech-heavy index retreated after posting a new all-time high of 18415. Then, it was all downhill in the next three sessions, ending last week down 1.2 percent to 17808. The trendline in question is breached, albeit marginally (Chart 1). The week also produced a shooting star, coming on the heels of the prior week’s spinning top.
Further, the index closed last week under 18000, which had earlier attracted sellers for three weeks before breaking out in the prior week. Last week, bulls were unable to defend the breakout. The index is now under both the 10- and 20-day. The 50-day is at 17554, which coincides with the daily lower Bollinger band at 17538. This level is a must-save.
Tech bears have an opportunity here. Should they succeed in building on the downside momentum of the last two weeks, the S&P 500 will be the next to lose the trendline support from last October. The sector has a leading weight in the index.
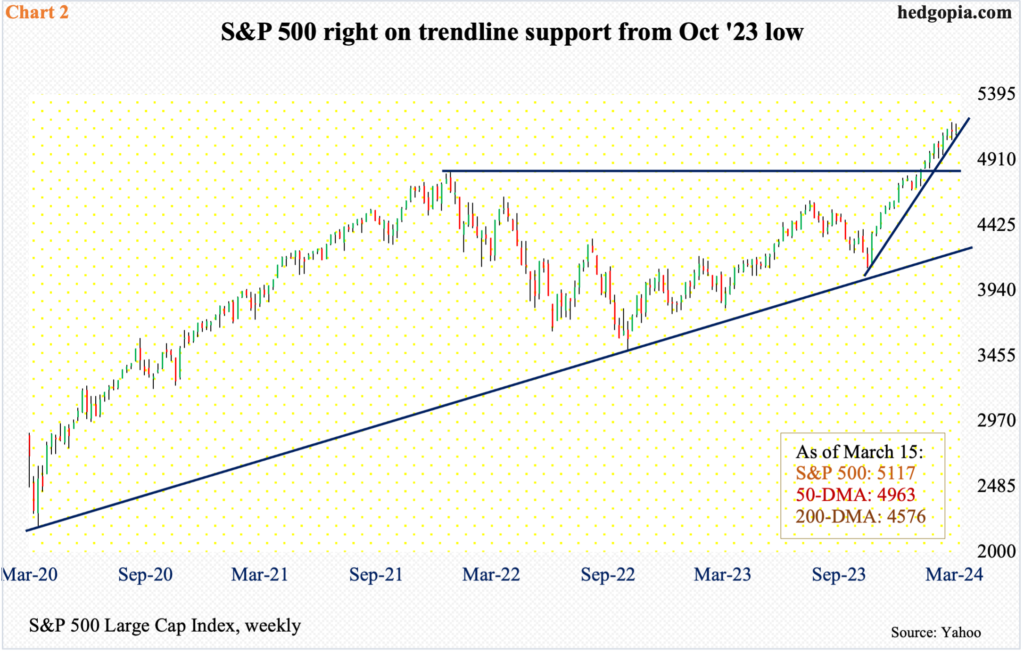
Last week, the large cap index closed right on that support (Chart 2), as the bulls failed to hang on to the weekly gains of one percent as of intraday Tuesday. By Friday, the gains turned into a loss of 0.1 percent. In the prior week, the S&P 500 lost 0.3 percent, having reversed on Friday after touching 5189 – a new high.
For the second week in a row, the S&P 500 has now produced a candle with a long upper shadow. Last week’s loss is only the fourth down week in 20.
Nearest support lies at 5050s, with the index closing last week at 5117.
Small-caps are faring worse.
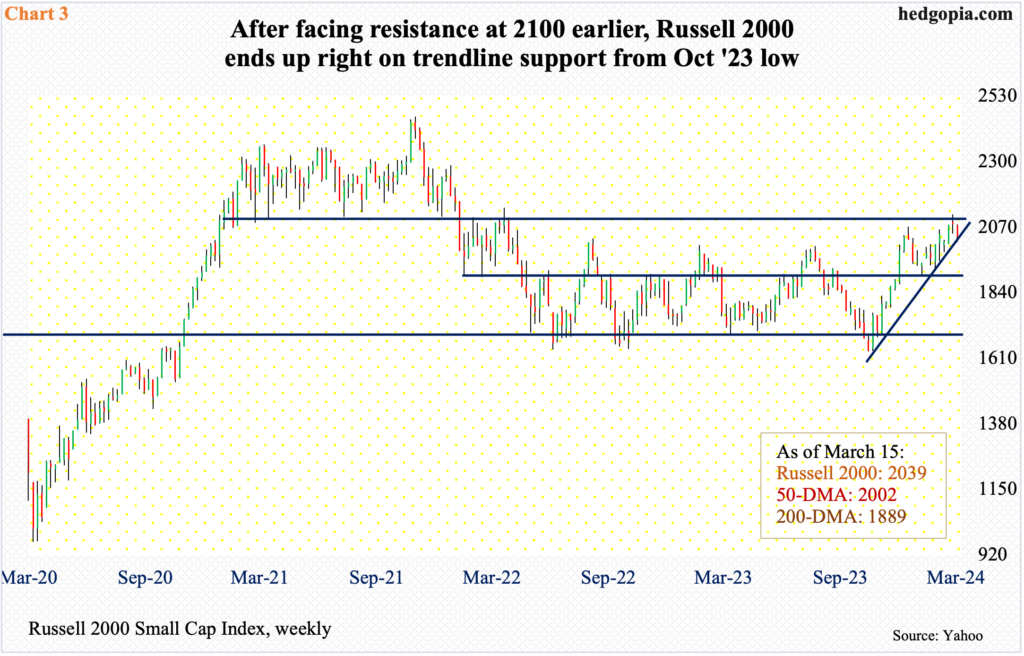
The large-caps lifted off last October’s low to rally to new highs this month, while the Russell 2000 remains substantially below its all-time high from November 2021. Back then, the small cap index retreated after touching 2459, subsequently bottoming at 1641 next June. That low was again tested in October that year (2022) with a low of 1642. Come last October, this level once again attracted bids at 1634. The rally that followed culminated just north of 2100 – 2116, to be precise – in the week before (Chart 3).
Horizontal resistance at 2100 goes back to January 2021. This also completed a measured-move target of a 1700-1900 range breakout on December 13th last year. After a weekly spinning top showed up at that resistance in the week before, the Russell 2000 gave back 2.1 percent last week to 2039. Thus far, 2000 is drawing buying interest. But once the trendline support from last October, which is where the index closed last week, gets breached, the door opens toward a breakout retest at 1900.
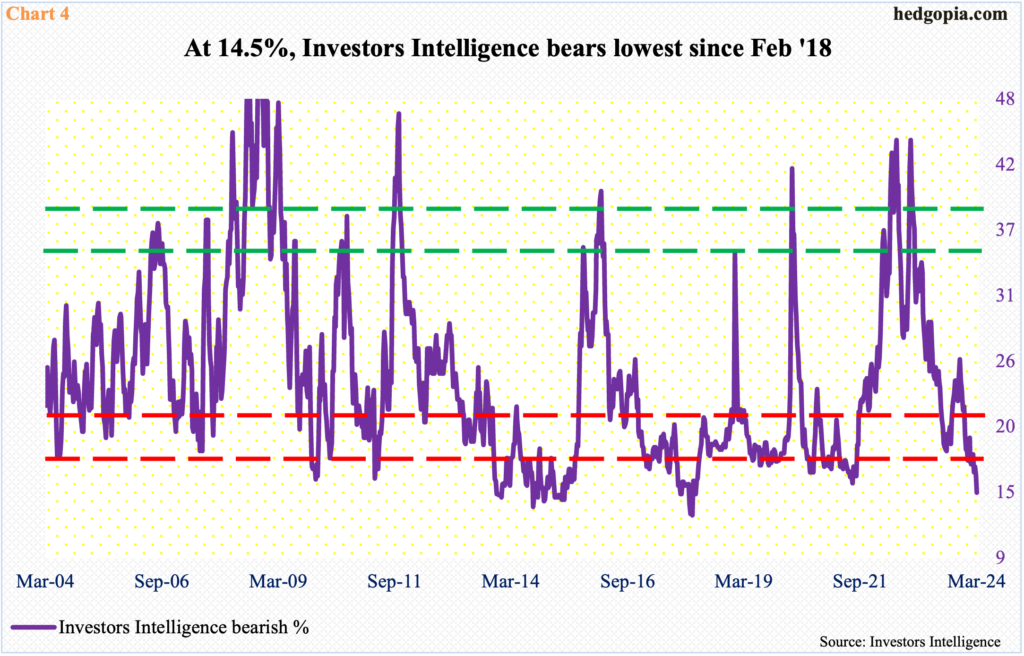
Equity bulls’ problem is that there are too many of them and that bears are too few. As of last Tuesday, Investors Intelligence bearish percent dropped 1.5 percentage points week-over-week to 14.5 percent. This was the lowest since February 2018 (Chart 4). (Bulls, in the meantime, rose 1.5 percentage points to 60.9 percent, which was the highest since July 2021.)
The sentiment boat thus is beginning to get lopsidedly bullish. At some point, there are no bears left to turn into bulls. This is when the upside momentum becomes vulnerable. As things stand, a decisive breach of the trendline mentioned above will swing the ball into the bears’ camp – duration and timing notwithstanding.
Thanks for reading!
