We are at that time of the year when buying pressure tends to rise. Bulls seem to be positioning for this. We saw a semblance of this last week. But there is still two months left before the year is out. It is a little too early for the seasonality factor to kick in fully. It is possible stocks weaken, hold support and then rally. In this scenario, shorts could decide how far it goes.
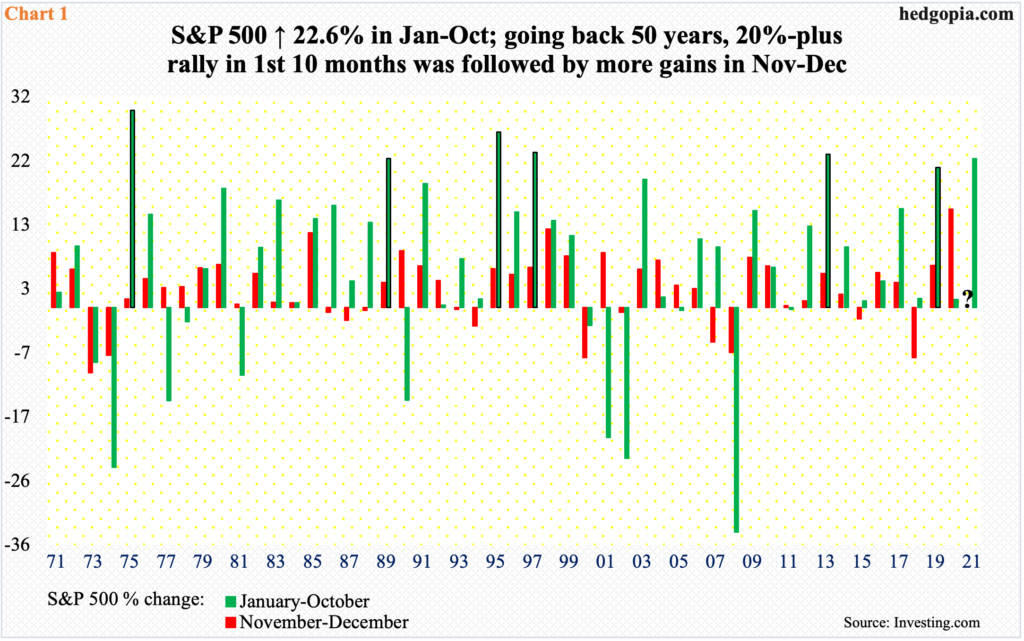
In the first 10 months this year, US stocks have done exceedingly well this year. The S&P 500 is up 22.6 percent, the Nasdaq 100 23 percent, and the Russell 2000 16.3 percent. If seasonality prevails, more gains are likely – at least equity bulls hope so.
For the broader S&P 500, this was the best January-October showing in eight years (Chart 1). In the last 50 years, there have been six years in which the index rallied north of 20 percent, and each followed with more gains in November-December (green bars with black borders).
Viewed this way, history is on the side of the bulls. This phenomenon in and of itself could begin to attract bids. We saw some of this last week.
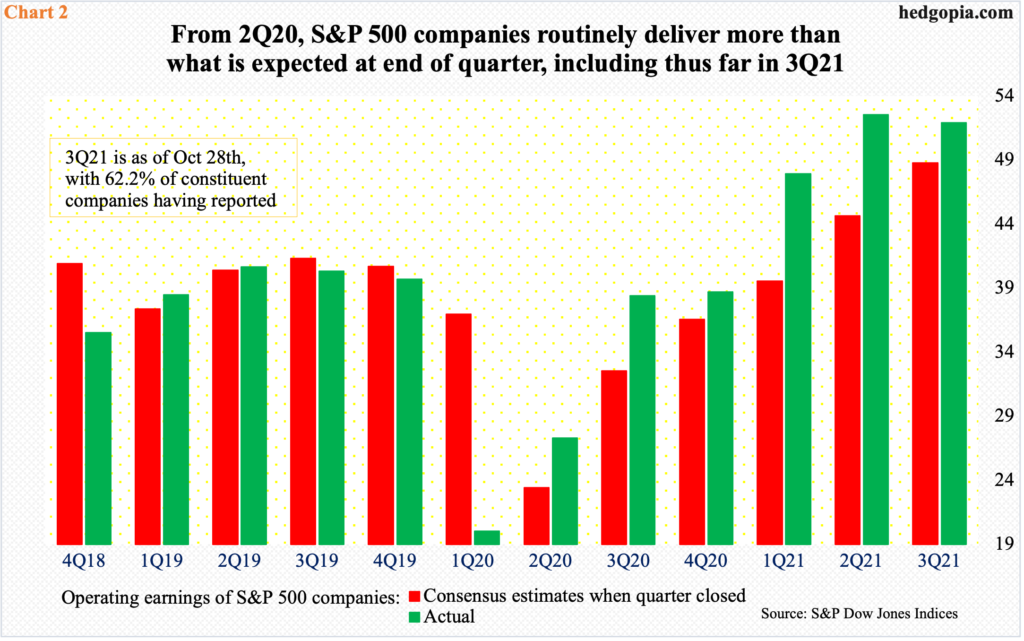
In the aggregate, earnings are coming in much better than expected. In January last year, the sell-side expected S&P 500 companies to ring up $50.35 in operating earnings in 3Q. Then Covid-19 hit, and these analysts brought out their scissors. By July last year, estimates dropped as low as $41.69. From that low, the revision trend has been nothing but up.
At the end of September – that is, when 3Q ended – estimates for the quarter were $48.26. With 62 percent of the companies having reported, blended estimates have risen to $51.43.
If this holds – it probably will – this would be the sixth quarter in a row in which earnings came in better than expected at the end of the quarter (Chart 2).
Five of the top six reported last week. Facebook (F) reported on Monday and was punished. Microsoft (MSFT) and Google owner Alphabet (GOOG) reported on Tuesday and were rewarded. Come Thursday, Apple (AAPL) and Amazon (AMZN) reported and were punished on Friday but only to close 2.3 percent and three percent respectively off the session lows.
Similarly, FB which was earlier down 5.1 percent on the week, rallied back above its 200-day to finish the week down 0.3 percent; the stock is below its 50-day. MSFT rallied 7.3 percent and GOOG seven percent last week to fresh highs. Both are comfortably above both averages. Ditto with TSLA, which has gone parabolic, up 22 percent last week alone, to a new high; it is up 42 percent in the last three weeks. Last week, AMZN closed right on its 50-day and slightly above its 200-day. AAPL is safely above the 200-day but is just slightly above the 50-day.
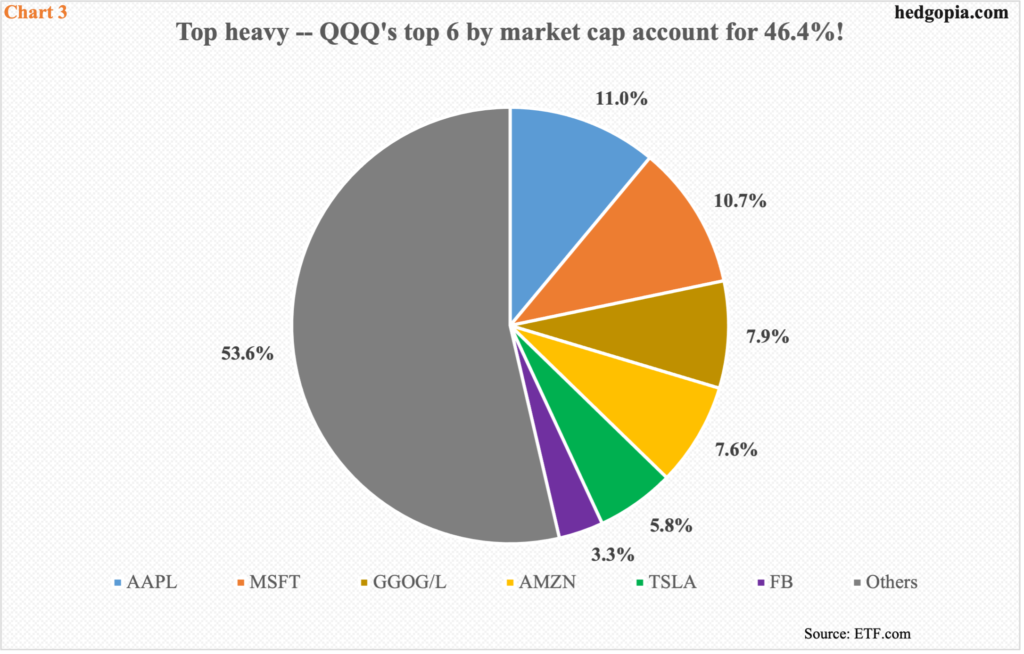
How they behave in the sessions/weeks ahead will have a bearing on market cap-based indices such as the Nasdaq 100. They command too big a share of the index. Combined, the six, which are the top six US companies by market cap, account for 46.4 percent of QQQ (Invesco QQQ Trust). Things are top heavy, to say the least (Chart 3).
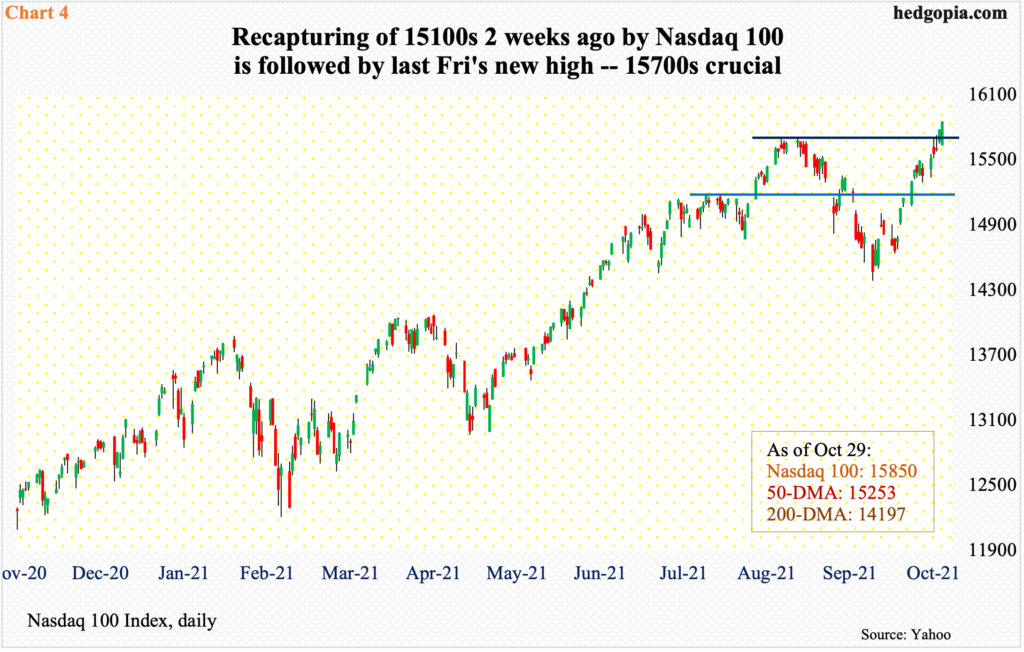
In the end, despite mixed results by the top six and mixed post-earnings reaction, the Nasdaq 100 managed to rally 3.3 percent last week.
Up until Wednesday, it looked like tech bulls would have trouble breaking out of 15700s, with sellers showing up right at that resistance on both Monday and Tuesday. Come Friday, the Nasdaq 100 (15850) produced a bullish marubozu/engulfing candle to take out the hurdle (Chart 4). Earlier on October 18, the index reclaimed 15100s.
Bulls have the momentum, and their mettle will be tested when 15700s gets retested, which is not that far away.
Before last week’s fresh breakout, Nasdaq short interest had rallied to a fresh record. Mid-October, short interest was up 1.4 percent period-over-period to 11.23 billion, edging past the prior high of 11.18 billion from mid-July 2008 (chart here).
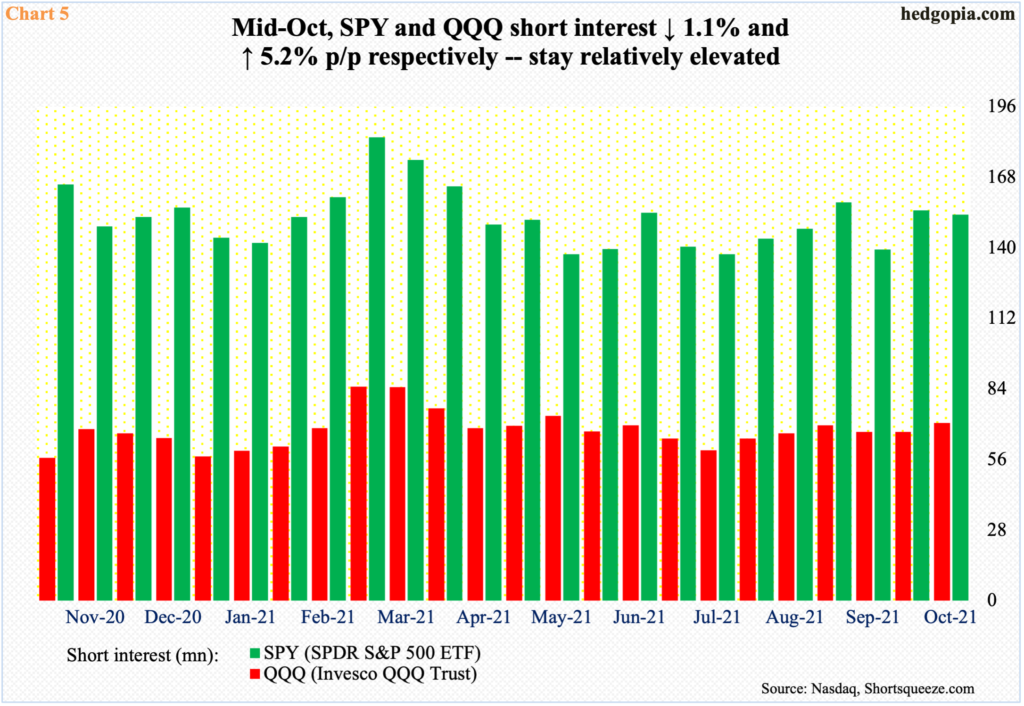
Concurrently, QQQ short interest rose to a five-month high as well mid-October. Speaking of which, short interest on SPY (SPDR S&P 500 ETF) sits relatively elevated (Chart 5).
If tech bulls play their cards right, overzealous shorts positioned for a down market can ironically get squeezed and provide a fuel for a rally.
In the small-cap arena, there is room for things to unfold similarly.
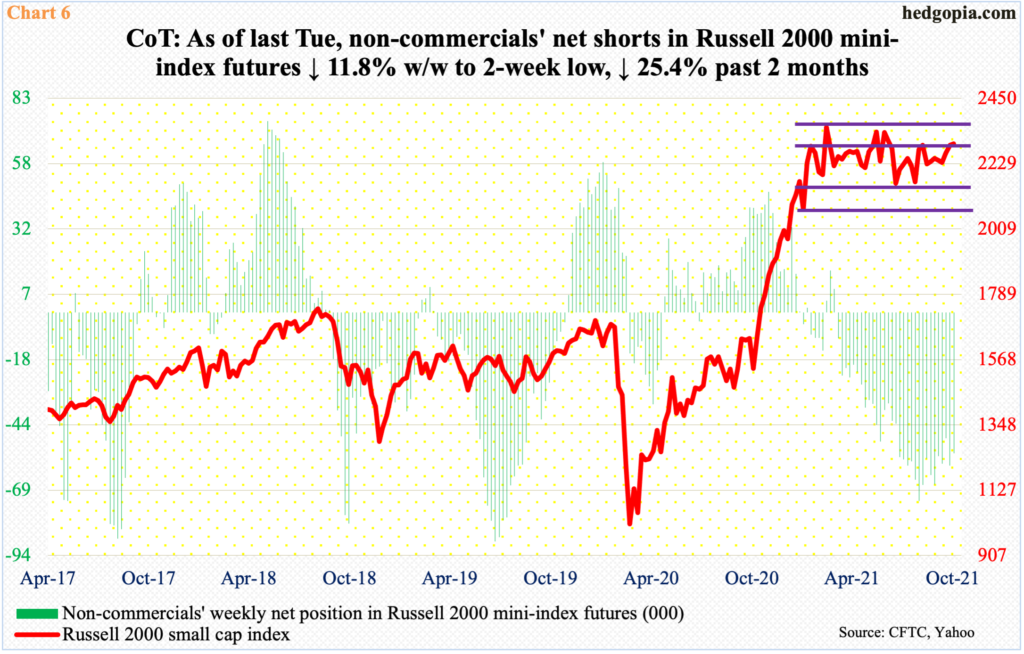
In the futures market, non-commercials are heavily net short Russell 2000 mini-index futures. As of last Tuesday, they were sitting on 54,431 net shorts, down 4.9k contracts week-over-week. In the past couple of months, holdings have dropped by 18.5k, with plenty of room for the green bars in Chart 6 to continue to shrink.
At least in theory, this could provide a tailwind for the cash, although the drop in holdings the past couple of months has not panned out that way, as the Russell 200 is trapped within a box.
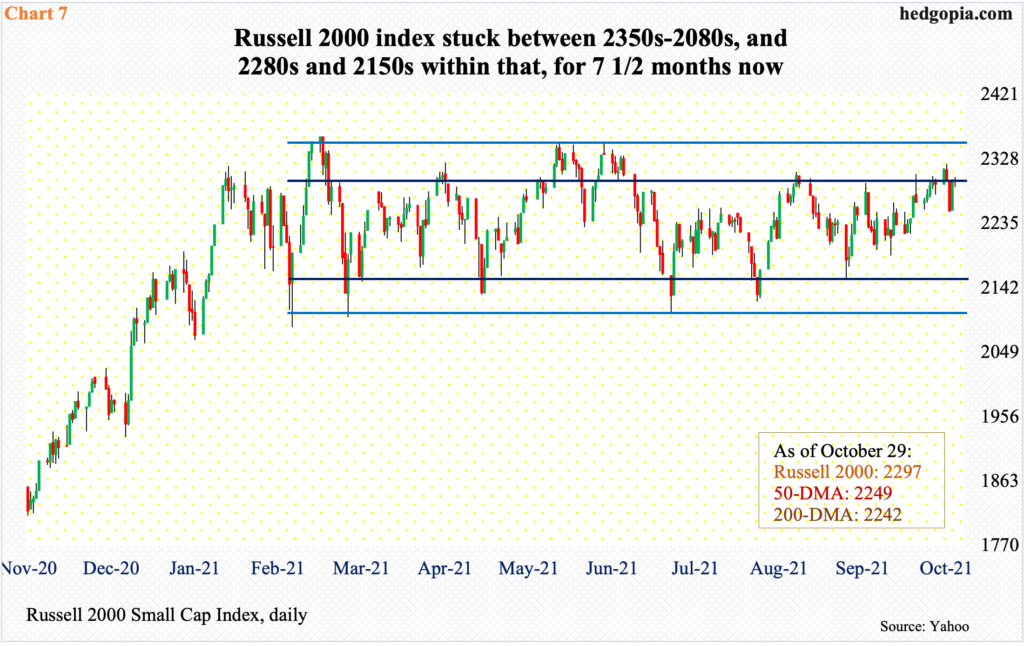
For seven and a half months now, the small cap index has been rangebound between 2350s and 2080s, and between 2280s and 2150s within this rectangle. In the week to August 24 when non-commercials held 72.9k net shorts, the Russell 2000 closed at 2231. Last Friday, the index closed at 2297, up three percent over that period, but the fact remains that it continues to trade within a well-established range.
Last week, at Tuesday’s high of 2321, the Russell 2000 was up 1.3 percent for the week and 1.7 percent from its all-time high of 2360 posted this March; by the end of the week, it was up merely 0.3 percent. That said, straight-line support at 2250s was defended both Thursday and Friday. Plus, the index is just north of 2280s resistance.
If small-cap bulls manage a breakout, the likelihood of non-commercials covering their shorts is decent – particularly considering the seasonality factor. The only thing is, there is still two months left before the year is out. So, it is equally possible stocks take a breather, suffer a mild selloff, hold support and then take off for a year-end rally. In this scenario, how far the rally goes will have a lot to do with if shorts give up and turn tail or doggedly stay put.
Thanks for reading!

