
Versus large-caps, small-caps inherently suffer from shorter operational history, less access to capital, lower trading liquidity, lack of support from most mutual funds, lack of familiarity, lack of/less Wall Street research, and what not.
Understandably, they are regarded as risky. When small-caps are leading, it is considered a bullish sign.
From Feb 11th through April 27th, the Russell 2000 small cap index rallied 22.6 percent in 10 weeks – relatively much better than 16.6 percent on the S&P 500 index and 16.7 percent on the Nasdaq 100 during comparable periods.
In normal circumstances, small-cap outperformance suggests a turn in the economy for the better, as these companies by nature are domestically-focused.
The latest small-cap rally, however, is more technical in nature, and less about the economy.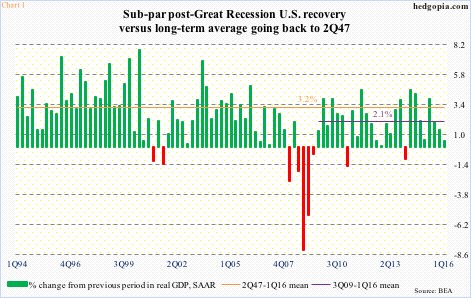
Take ISM manufacturing, for example. March’s 51.8 was preceded by five consecutive months of sub-50 reading. April again dipped a point month-over-month to 50.8 – teetering on contraction. Non-manufacturing fares better, with April at 55.7, but down from 59.6 last July. This is just one data point, but enough to drive home the point that the economy is struggling. The first print of 1Q16 real GDP showed growth decelerated further to a mere 0.5 percent (Chart 1).
If fundamentals are not driving it, then technicals have to start playing a bigger role.
And on this front, things are at a crucial juncture.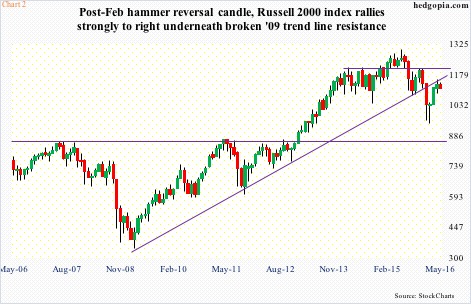
During the January (2016) collapse in U.S. stocks, the Russell 2000 fell out of a rising trend line drawn from March 2009 (Chart 2). February produced a hammer reversal, followed by strong March and April, resulting in the afore-mentioned rally.
More importantly, the April high kissed the underside of the March 2009 broken trend line, and got rejected. More often than not, once a trend line of this significance is broken, it tends to repel rally attempts. So far, that is exactly how it has turned out, with May down 1.6 percent thus far.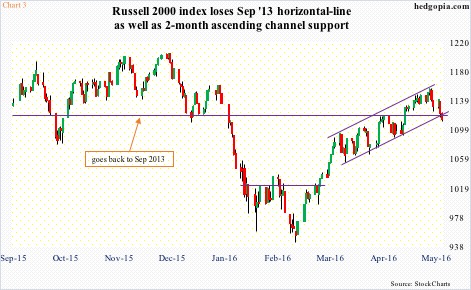
Yesterday came more signs that the small-cap rally that began nearly three months ago is at risk of falling apart. By Tuesday close, the Russell 2000 was sitting right on dual support at 1120-ish – horizontal line going back to September 2013 as well as two-month channel (Chart 3).
Yesterday, it lost both; AM weakness was bought, but was then repelled hard by the 200-day moving average, which is dropping. The 50-day, going flat, is only 1.2 percent away, so could provide support near term. But the real risk is if weekly indicators, which are way overbought, begin to take hold, which is looking probable.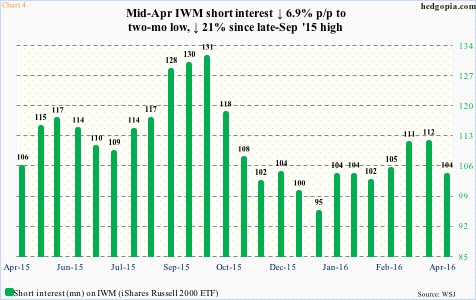
At least looking at short interest on IWM, the iShares Russell 2000 ETF, there is not much support coming from shorts. Mid-April, short interest stood at 103.9 million shares, not a whole lot different from 102.4 million on February 12th (Chart 4). There is not much squeeze fuel for small-cap bulls to go after.
There is, however, in the futures market.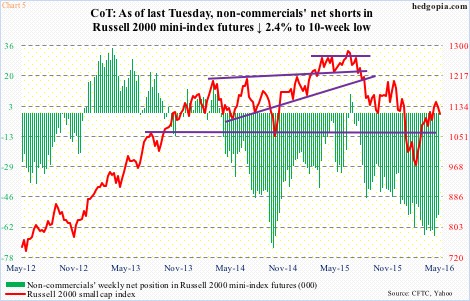
As of Tuesday last week, non-commercials were net short 55,487 contracts in Russell 2000 mini-index futures. This was down 2.4 percent from the prior period, but up 12 percent from February 9th (Chart 5). In other words, since the rally started, these traders have doggedly stayed bearish, and are unlikely to give up now – now that major resistance has held (Chart 2) and support has been lost (Chart 3).
Odds favor the Russell 2000 continues to unwind overbought weekly conditions.
Thanks for reading!
