
Last week, equity bulls stepped up in time to save a rising 14-month trend line on the S&P 500. A similar trend line has been breached on the Nasdaq 100, which acts weak. It is just a matter of time before a breach occurs on the S&P 500.
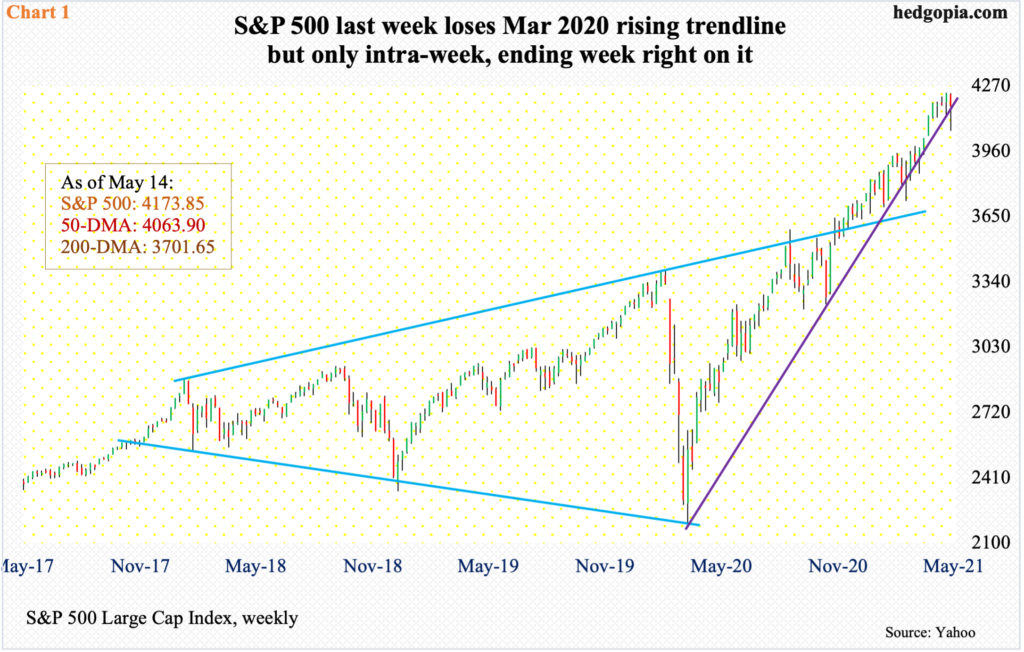
The S&P 500 last week came very close to breaking a rising trend line from the low of March last year. At Wednesday’s low of 4056.88, the large cap index (4173.85) was down 4.2 percent for the week, and the trend line was decisively broken. From that low, it then rallied 2.9 percent on Thursday and Friday to finish the week down only 1.4 percent, ending right on that support (Chart 1).
Bids showed up just above the rising 50-day. Since reclaiming it in late April last year, the S&P 500 has tested the average eight times and is yet to breach it on a sustained basis. This, however, may not mean the coast is clear similar to the prior seven times.
Near term, there is room to rally. Medium term, weekly candles are worthy of attention. A hanging man was formed last week. This was preceded by a hanging man, a gravestone doji and a dragonfly doji in the prior three weeks. These are potentially bearish candles and need confirmation.
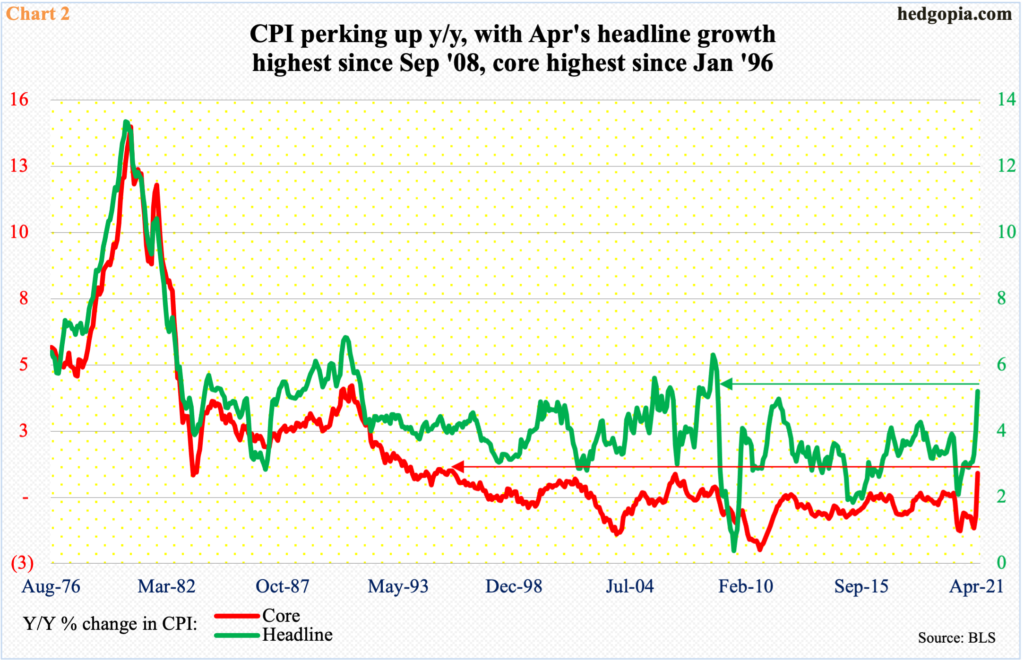
Wednesday’s 2.1 percent tumble in the S&P 500 was owed to a hotter-than-expected consumer price index report. In the 12 months to April, headline CPI jumped 4.2 percent and core CPI three percent. This was the fastest pace since September 2008 and January 1996, in that order (Chart 2).
For nearly four decades now, inflation has been rangebound, with a downward bias. Investors remember how inflation gradually built up in the late ’70s to hit mid-double digits in the early months of 1980.
Post-pandemic, headline CPI bottomed at 0.1 percent last May and core CPI at 1.2 percent last June. So, prices are clearly showing upward momentum.
Investors were already jittery by May 4 comments by Treasury Secretary Janet Yellen that the economy may be overheating and interest rates may have to rise, although speaking at a different event later that day she tried to walk back her comments, saying any price increases would be transitory.
The current debate is not about if inflation is percolating, rather if the expected increase is transitory or persistent. The Fed believes it is the former. Speaking the same morning post-CPI report, Vice-Chair Richard Clarida said he was “surprised” by the jump in inflation but stressed that this would prove transitory.
The long end of the Treasury yield curve is rallying, with the 10 year (1.64 percent) having bottomed at 0.4 percent in March last year and ticked 1.77 percent on March 30 this year. But two-year yields, which tend to be the most sensitive to interest rate policy, are well anchored at 0.15 percent to 0.16 percent. This is giving the Fed leeway.
Markets have upped their inflation expectations but even here they expect pricing pressure to moderate in outer years.
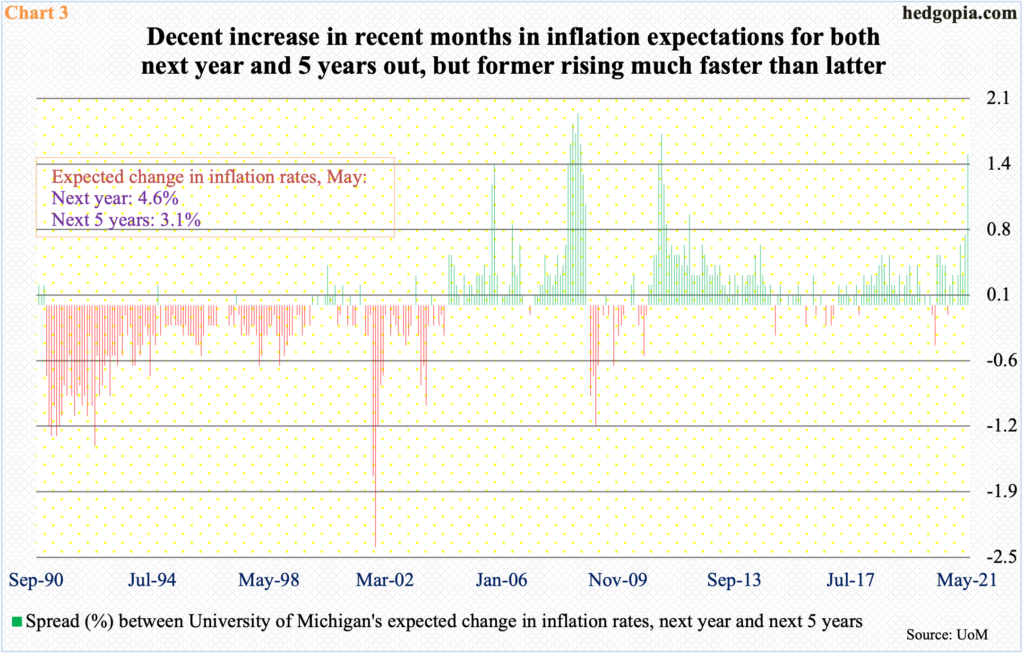
The University of Michigan’s preliminary reading for May showed survey respondents expect inflation to rise 4.6 percent next year and 3.1 percent in the next five years, for a spread of 1.5 percentage points (Chart 3). As recently as last December, the spread was zero, with expected inflation of 2.5 percent for both periods.
Despite the recent uptrend, once again, the message is that inflation is rising but contained.
The macro picture has taken a sharp turn higher from Covid-spurred depressed levels. The first estimate showed real GDP grew 6.4 percent in the first quarter, coming on the heels of 4.3 percent increase in 4Q20 and 33.4 percent jump in 3Q. Before that, the economy contracted 31.4 percent in 2Q and five percent in 1Q.
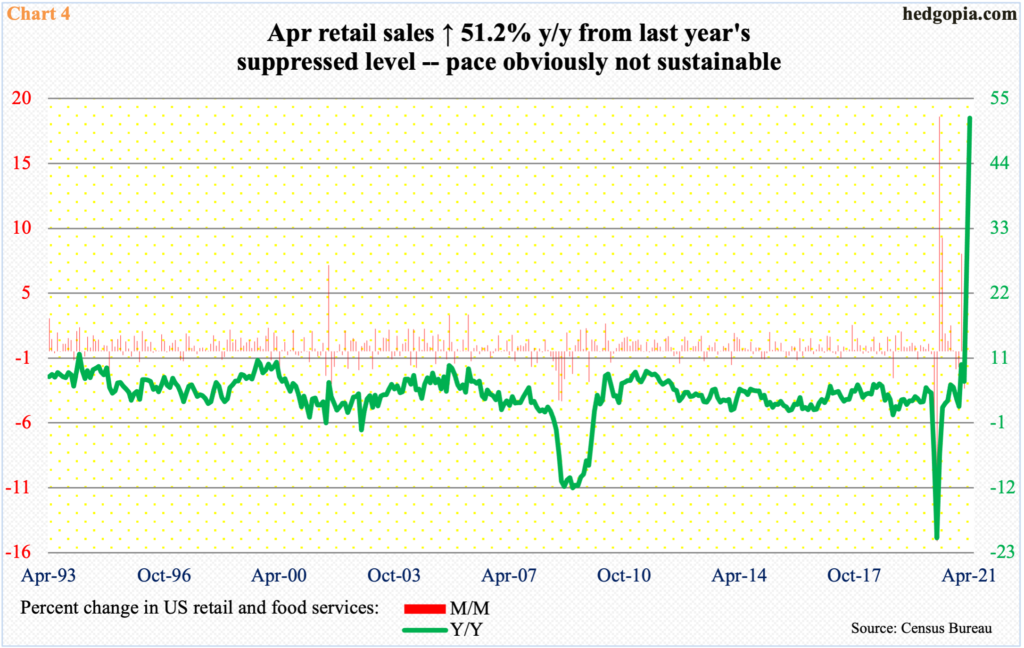
There is plenty of liquidity sloshing around in the system – both fiscal and stimulus – with the former in particular giving a nice jolt to economic activity post-pandemic. In April, retail sales were essentially unchanged month-over-month to a seasonally adjusted annual rate of $619.9 billion – a new record – but surged 51.2 percent year-over-year (Chart 4). No one believes this pace is sustainable. This lends credence to inflation doves’ argument that we are not headed for a repeat of how things evolved in the ’70s.
This ensures an accommodative monetary policy as far as the eye can see. A majority of FOMC members do not expect a hike in the fed funds rate – currently in a range of zero to 25 basis points – until at least the end of 2023. Stocks reflect this. From the low of March last year through its new all-time high of 4238.04 posted on the 7th this month, the S&P 500 rallied north of 93 percent.
But this also suggests a perfect scenario has been priced in. Hence the quick jitters around inflation fears last week. With this as a backdrop, it does not take long before there is a meaningful increase in investor temptation to lock in profit. In fact, the weekly candles mentioned earlier suggest this may be going on but in a subtle way.
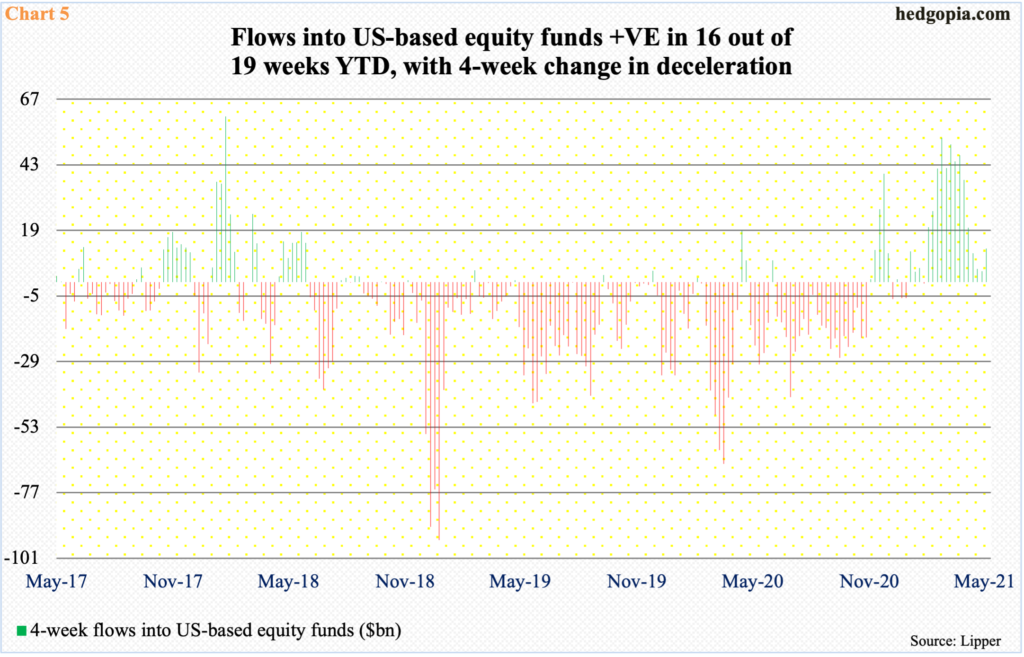
The S&P 500 has essentially been sideways for a month now (Chart 1). Flows have improved. Through last Wednesday this year, US-based equity funds gained $112.5 billion. At the same time, look deeper and the trend is in deceleration. In the latest week, the four-week change softened to $12.3 billion (Chart 5).
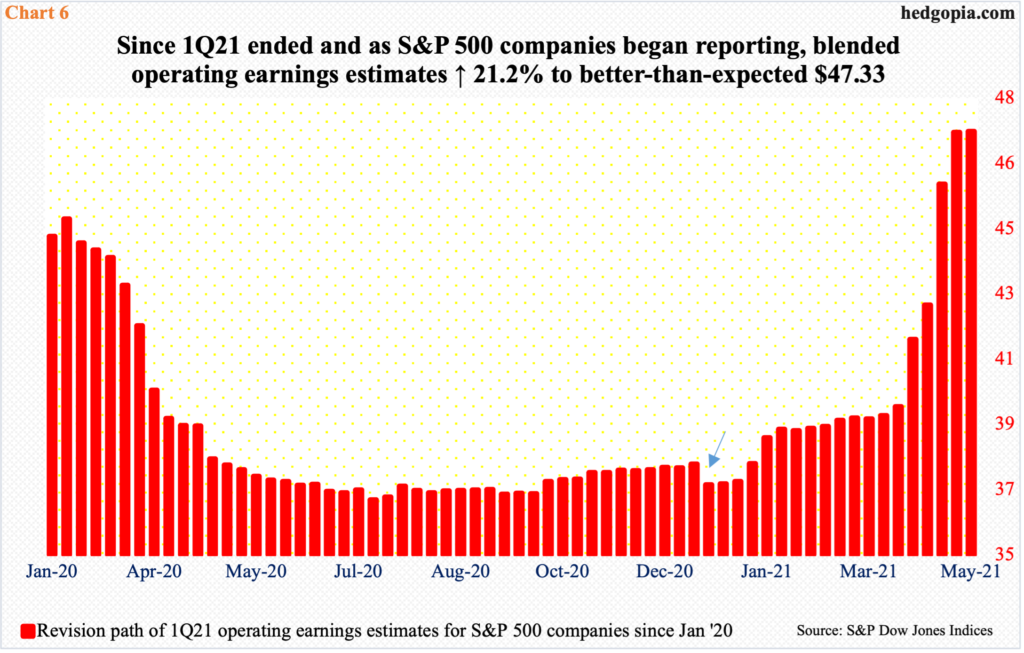
The sideways action in the S&P 500 is also taking place at a time when companies are beating 1Q21 earnings estimates by a mile.
When the quarter ended at the end of March, operating earnings estimates for S&P 500 companies were $39.05. In the six weeks since, as results began to get reported, blended estimates were revised higher every week. As of last Wednesday, with nearly 89 percent of the reporting done, earnings were $47.33 (Chart 6).
The S&P 500 not being able to rally on this implies this was in the price. Hence the importance of the trend line from March last year. A breach can set in motion sustained downward pressure.
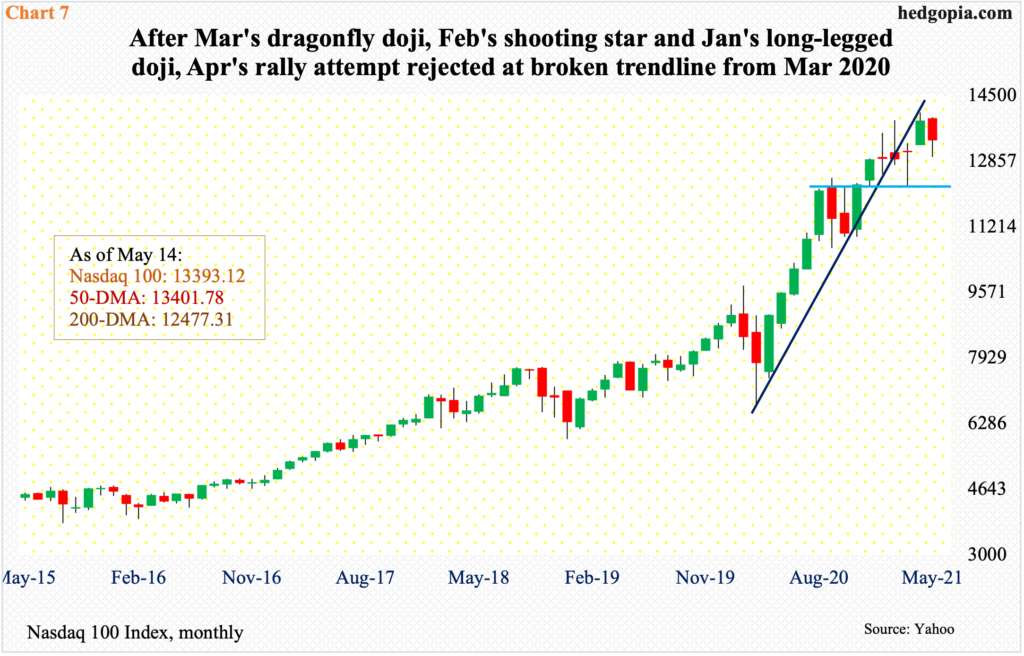
We saw this unfold on the Nasdaq 100. The March ’20 trend line was breached in late February. After that, the tech-heavy index (13393.12) went on to post a new high of 14073.48 on April 29, but only to get rejected at the underside of that trend line (Chart 7).
The medium- to long-term picture is worsening. January formed a monthly long-legged doji, followed by a dragonfly doji in February and a gravestone doji in March. The index tried to negate all these potentially bearish candles by rallying 5.9 percent in April, but with 10 sessions to go this month, it is down 3.4 percent.
Bulls put foot down in the middle of last week, ending on the 50-day. In the right circumstances, there is room to rally near term. This is also true with the S&P 500, with rising risks of a breach of the trend line in question sooner than later.
Thanks for reading!
