
The S&P 500 is within striking distance of a new high, even as margin debt is substantially below last May’s record high. Concurrently, unlike in the past, VIX refuses to sustainably drop to high single digits/low double digits.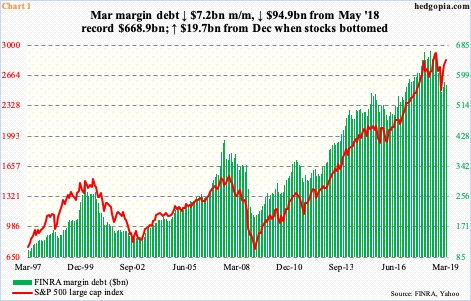
Margin debt is beginning to diverge from stocks. Historically, the two tend to move in tandem (Chart 1). This time around, there is a slight divergence. It is possible margin debt is at the early stages of leading.
In March, FINRA margin debt fell $7.2 billion month-over-month to $574 billion. The S&P 500 large cap index rallied 1.8 percent in that month. In the first three months this year, the index jumped 13.1 percent, margin debt only grew by $19.7 billion.
Margin debt in fact peaked as far back as last May at $668.9 billion – well before the October-December rout in stocks. It did bottom in December at $554.3 billion, although, as stated earlier, the rise since has been muted.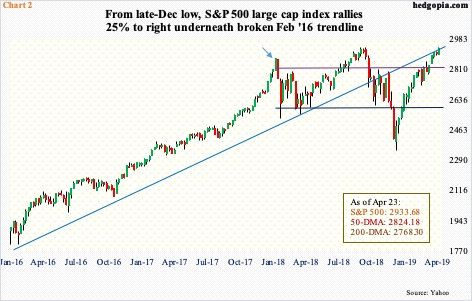
With five sessions to go, the S&P 500 is up another 3.5 percent in April. Margin debt may or may not have played a role in this. We will find out when April’s numbers are reported in a month. We know this much. In January last year, the S&P 500 began a nasty, quick double-digit drop from 2872.87 (arrow in Chart 2). Margin debt stood at $665.7 billion back then, only $3.2 billion from the record high set four months afterwards. The index currently sits higher than the January high, but not by a whole lot. Arguably, it has since gone sideways within a wide range. Viewed this way, the $94.9-billion drop in margin debt since last May has mattered.
The S&P 500 (2933.68) currently rests at crucial juncture – 0.25 percent from last September’s record high. After bottoming late December, it rallied past both 2600-plus and 2800-plus. Currently, it sits right below a broken trend line from February 2016. A breakout, followed by a new high, can induce risk-on. If traders are still not willing to add to leverage in this scenario, then we can pretty much deduce that margin debt has peaked.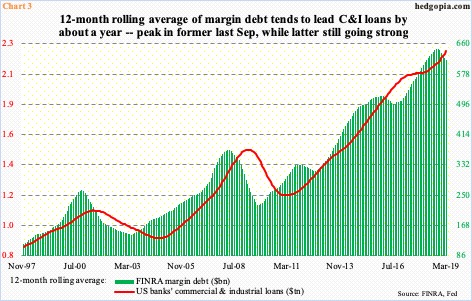
A peak in margin debt can potentially reverberate through the economy through another channel.
Chart 3 uses a 12-month rolling average to plot margin debt against US banks’ commercial & industrial loans. In the past, the former has tended to lead by about a year. Thus far, the 12-month average of margin debt peaked last September at $646.3 billion, with March at $616.6 billion. C&I loans are still going strong, with March at a seasonally adjusted annual rate of $2.26 trillion. If margin debt has indeed peaked, C&I loans should begin to roll over later this year. For this scenario to pan out, the US economy likely continues to decelerate.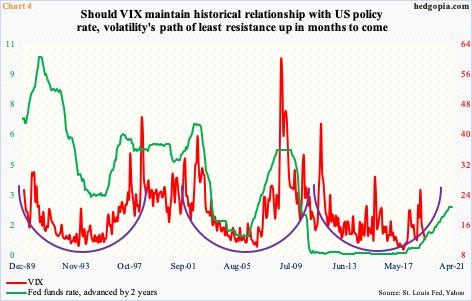
The historical relationship between VIX and the fed funds rate is another reason why risk-on is likely to recede in the months ahead. In the past, the policy rate has led volatility by about two years.
After remaining zero bound for seven long years, the fed funds rate was raised by 25 basis points in December 2015. Since then, there have been eight more 25-basis-point hikes. The last one was last December, when the Fed took rates to a range of 225 to 250 basis points. In November 2017, VIX made an all-time low of 8.56. Since then, it spiked twice – one in February and the other in December last year. Since that first spike, VIX (12.28) has relatively remained at a higher plateau. Last Wednesday’s intraday low of 11.03 was the lowest since last August. It has more or less hugged 12 for a month now, even as the S&P 500 is within spitting distance of a new high. The scenario of a gradual increase in volatility also fits with a potential saucer bottom that VIX may be in the process of completing (Chart 4).
Thanks for reading!
