
Are we seeing a classic ‘stocks turn ahead of fundamentals’ phenomenon?
U.S. equities in general bottomed on February 11th after a brutal sell-off in January. From late-December 2015 highs through the afore-mentioned low, the S&P 500 index dropped 13 percent (Chart 1).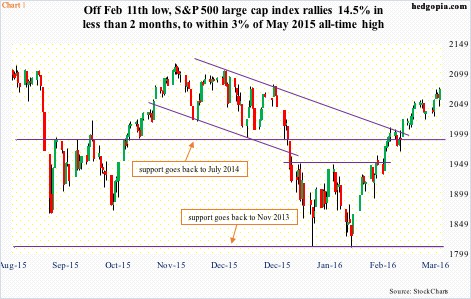
At the time, there was a mini panic in the air. Macro data – globally – were coming in weaker than expected. Growth forecasts were being revised down. Recession fears were rampant in the U.S.
By December, the ISM manufacturing index had dropped for three consecutive months – the first three-month contraction post-Great Recession. Orders were down for two straight months. The spread between orders and inventories stood at 5.3 in December, earlier having dropped to 1.3 in September (Chart 2).
By the time stocks bottomed on February 11th, ISM manufacturing produced one more sub-50 reading in January. Even the hitherto reliable non-manufacturing dropped to 53.5 in January, with orders at 56.5, down respectively from 59.6 and 62.6 last July.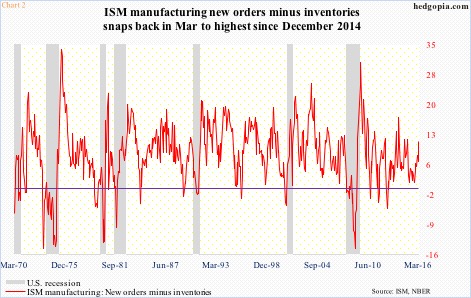
Stocks ignored all this, and rose. And rose they did.
Nearly two months after the afore-mentioned bottom through recent highs, stocks rallied massively, with the S&P 500 up 14.5 percent, the Dow Industrials 14.8 percent, the Nasdaq 100 16.5 percent, the Dow Transportation index 17.9 percent, and the Russell 2000 index 18.5 percent, among others. All in less than two months.
Then last Friday, ISM manufacturing for March came out. The index rose to 51.8, snapping out of five straight months of contraction. Orders jumped 6.8 points month-over-month to 58.3. The latter in particular was the highest since 62.5 in November 2014.
Is the latest ISM print vindication for the latest run in equities? Sort of.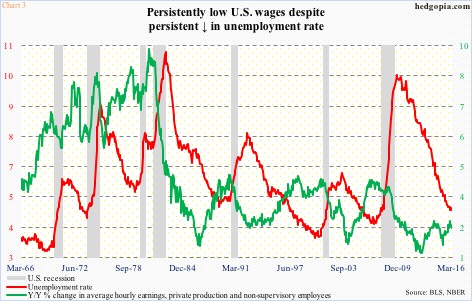
Also on Friday, March’s employment report was yet another data point showing things were not falling apart as the January collapse in stocks possibly implied.
March produced 207,000 non-farm jobs, for an average 207,000 in the first three months. This compares to first-quarter average of 190,000 in 2015 and 209,000 in 2014. The unemployment rate edged up to five percent, half what it was in October 2009 (Chart 3).
Similarly, average hourly earnings of private-sector production and non-supervisory employees rose 2.3 percent on an annual basis – decent but not great. Once again, things were hanging in there.
A couple of things are worth consideration in this regard.
One, would recovery in manufacturing continue? The March jump in ISM manufacturing is just one month’s data. The Atlanta Fed’s GDPNow is forecasting real GDP growth in the first quarter of mere 0.7 percent. For growth to improve in subsequent quarters, manufacturing has to pull itself out of a funk.
Second, should growth ameliorate, and stocks follow, what would become of the bearish signals previously discussed on this blog, and elsewhere?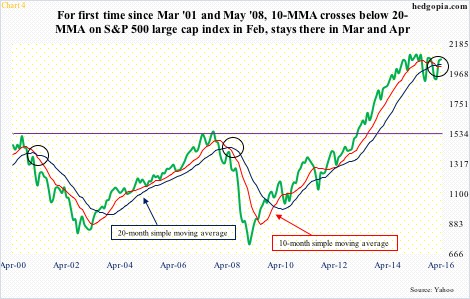
Chart 4 plots a monthly chart of the S&P 500 with 10- and 20-month simple moving averages. For the first time since March 2001 and May 2008, 10-MMA crossed below 20-MMA in February. We know how those two crossovers ended (circles in the chart). The present crossover continued in March, and, as of last Friday, in April as well.
That said, because of the recovery in stocks in February and March, 10-MMA is now flattish. Should stocks continue to do well, the bearish signal will be nullified sooner or later. But not until the S&P 500 rallies north of 2400 this month. Next to impossible!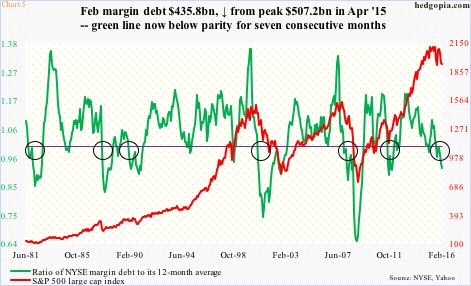
Then we have Chart 5, which plots the S&P 500 against a ratio of NYSE margin debt to its 12-month average. Margin debt has been declining since it peaked last April at $507.2 billion – down $71.3 billion as of February.
The green line, once it dips below one, signifies waning momentum, which has been the case since last August – for seven months now. Historically, the longer this persists, the more the pain for stocks. This is why the massive rally in stocks in March is so relevant.
March’s margin debt is not due out until later this month, but if it followed stocks higher and came in at at least $483 billion, then the ratio would switch back to over one. That would be a win for the bulls, but a $47-billion increase in one month? It is a tall order, but it is prudent to keep an open mind.
Positively for the bulls, no matter how overbought major indices are, resistance has fallen like dominoes – one after another. Buy orders are showing up on pullbacks near broken resistance. On the S&P 500 last Friday, initial weakness was bought near resistance-turned-support at 2040 (Chart 1).
The question is, how long before the prevailing momentum peters out?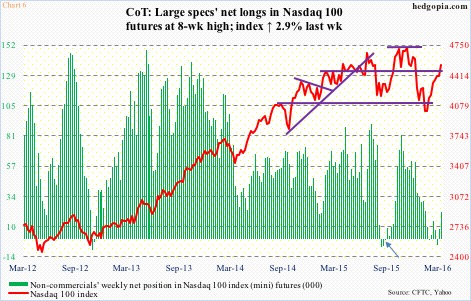
Bulls for sure hope non-commercials have just begun to load up on net longs in Nasdaq 100 index (mini) futures. Two weeks ago, they were net short. As of Tuesday last week, they had 21,130 in net longs (Chart 6).
Now, assuming these traders are on the same path as in the wake of the August/September sell-off last year, those green bars in Chart 6 can gain height. Back then, they were net short 616 contracts mid-September (arrow) and ended at 81,564 by November 10th. The Nasdaq 100 added nearly 200 points during the period.
It is just a scenario. May or may not pan out. But at this point in the rally’s life, it is perhaps prudent to lean cautious.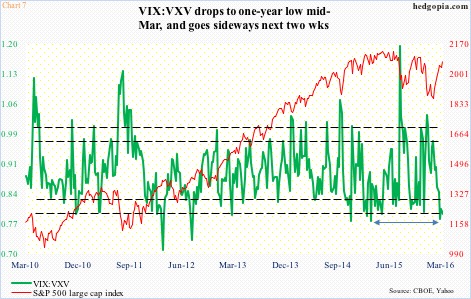
The VIX to VXV ratio is urging us to do so. Mid-March, it dropped to .782 – the lowest since .779 a year ago. For the next two weeks, it essentially went sideways, with .794 last Friday (Chart 7).
Historically, whenever the ratio drops this low, the odds of a reversal rise. Of course, there have been exceptions (twice in 2012, for instance). That said, risk/reward odds strongly favor a reversal sooner than later, and equities would not like that.
Thanks for reading!
