
The Russell 2000 small cap index (1370.70) is stuck in a rut at a higher plateau. Sort of.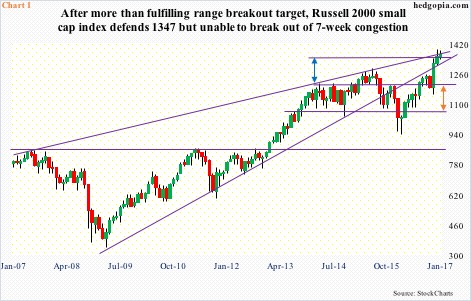
The index has gone sideways for seven weeks now. In the meantime, it rose to an all-time high of 1392.71 on December 9. A slightly declining trend line drawn from that high has provided stiff resistance, including last Thursday.
The sideways action – in a flag formation – preceded a range breakout.
Back in March 2014, the Russell 2000 began to retreat after hitting 1212.82, then dropping to 1082.53 by May that year. Those two levels then became a persistent source of resistance and support, marked by false breakouts and breakdowns along the way.
Come last November, not only did the index break out but also went parabolic, hurriedly fulfilling the measured-move range breakout target of 1340-ish. Not surprisingly, bulls and bears are toughing it out around that level (1347 also represents horizontal support going back to November 25, is where a rising trend line from February 2016 meets, and is approximated by the 50-day moving average.)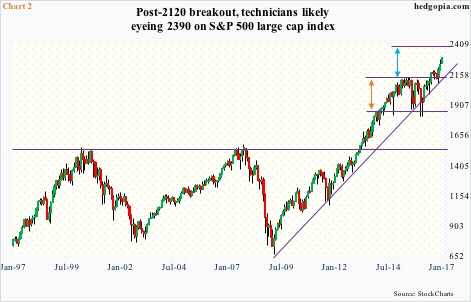
There have been similar box breakouts on other indices, but unlike the Russell 2000 they are yet to fulfill.
The S&P 500 large cap index first hit 2119.59 in February 2015, which in May that year was surpassed by the then-record high 2134.72. But in due course the 2120 level proved to be an important level where bulls and bears locked horned quite a few times. In the meantime, bulls were able to forge solid support at 1800-plus.
In July last year, bulls conquered 2120, followed by a brief loss into the pre-U.S. presidential election bottom (Chart 2). If things proceed according to the technical rule book, there is room for the S&P 500 (2294.62) to rise to just under 2400.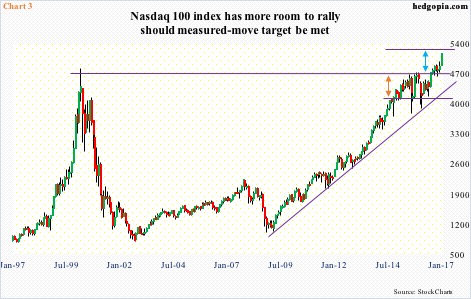
Between July and August 2015, the Nasdaq 100 index dropped intra-day from 4694.13 to 3787.23 – for a drop of over 19 percent. That turned out to be an important high, as 4700 has been a persistent source of both resistance and support. This was the upper end of a months-long range. The bottom end lied at 4100, which can be extended to August 2014 – or as far back as 2000.
Post-election, the Nasdaq 100 lagged other major U.S. indices, but has been outperforming this year, up 6.3 percent year-to-date, versus 2.5 percent for the S&P 500, one percent for the Russell 2000, and 1.7 percent for the Dow Industrials.
If the Nasdaq 100 (5168.06) proceeds to fulfill the measured-move target, technicians would be eyeing 5300 (Chart 3).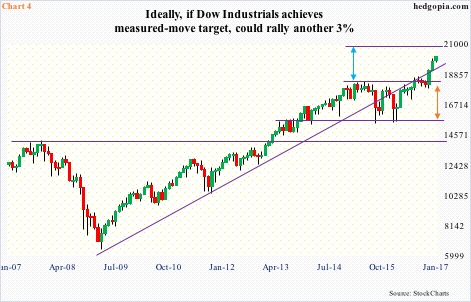
The first time the Dow Industrials reached 15000 was in May 2013 (intra-day high of 15542.40). After a break out of that level in November that year, bulls persistently showed up near that support – including February and October 2014, August 2015, and January and February last year.
As this was taking place, resistance was forming around 18200, which got convincingly taken out last November. The Dow also reclaimed a rising trend line from March 2009, which it stayed under beginning August 2015 until last December; once again, 15000 support saved it from things getting much worse back then.
Post-November breakout, things look a little parabolic, but if everything works out as suggested by technicals, the Dow (20093.78) could be headed for 20700.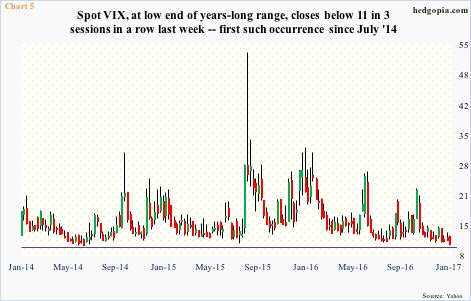
This is woulda, coulda, shoulda.
The measured-move targets may or may not fulfill, or may even exceed as has been the case with the Russell 2000 (Chart 1). If it fulfills, one can think of a scenario in which VIX continues lower, and shorts continue to get squeezed. Its all-time low of 9.39 was reached in December 2006, and is at the low end of a years-long range, with the last three sessions last week closing below 11. We have to go back to July 1-3, 2014 to experience three consecutive intra-day drops below 11.
One possible clue as to what might transpire is what happens when breakout retest takes place. Except for the Nasdaq 100, these indices consolidated their post-election rallies by going sideways, with breakouts last Wednesday. The Russell 2000 has been unable to break out. The S&P 500 and the Dow are only 0.6 percent and 0.5 percent away from breakout retest, respectively. Indices are extended technically.
Viewed this way, it is entirely possible they begin to weaken without fulfilling the afore-mentioned targets, which are only useful as reference points but not etched in stone. VIX, for instance, is flashing a tremendous amount of indecision. This is how the last three sessions looked – doji, inverted hammer, and doji.
Thanks for reading!
