
It has been a long wait… yet it keeps eluding.
Six years into the current expansion, U.S. wages are yet to pick up speed. Yes, companies ranging from Wal-Mart (WMT) to Aetna (AET) to Starbucks (SBUX) to Target (TGT) have announced wage hikes, but it has not been widespread.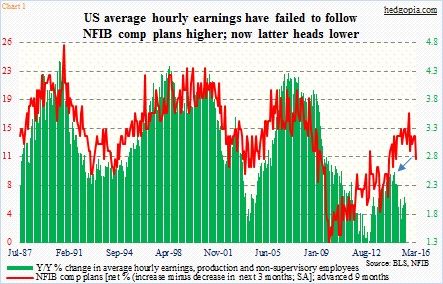
Average hourly earnings of U.S. production and non-supervisory employees remain subdued. They rose 1.9 percent in June year-over-year, and are yet to hit three-percent in the current expansion. The green bars on the right side of Chart 1 are much lower than in past cycles.
In the same chart, the red line represents the National Federation of Independent Business members’ compensation plans, which are advanced by nine months. Historically, it tends to track the green bars. A couple of things jump out. One, comp plans have been suppressed in this cycle compared to past cycles. Two, the green bars began to diverge last August (arrow in the chart), as they peaked and headed lower. The red line kept rising until peaking in December at 17; June was 11.
Here is the thing. If the historical relationship holds, we might be looking at a situation in which the green bars continue to come under pressure in the outer months.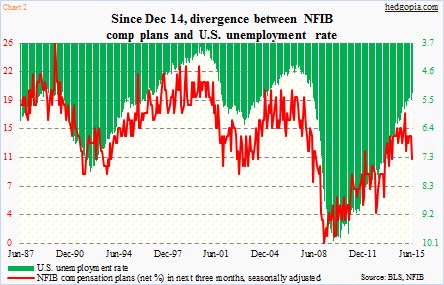
Chart 2 drives home the same point. Once again, the red line represents NFIB comp plans, and is plotted against the U.S. unemployment rate. It has been a while the red line has stopped following the green bars. Comp plans have come down from 17 last December to 11. The unemployment rate in the meantime dropped from 5.6 percent to 5.3 percent.
The persistent drop in the unemployment rate obviously raised hopes that the red line would track the green bars, which is what has taken place traditionally. It has not happened. One primary reason is the existence of slack in the economy. Since the Great Recession ended, the unemployment rate has dropped 420 basis points. Job creation has helped, but so has the increase in the number of people exiting the labor force. When post-Great Recession recovery began in July 2009, the ‘not in labor force’ category stood at 81.4 million; this June, this was 93.6 million.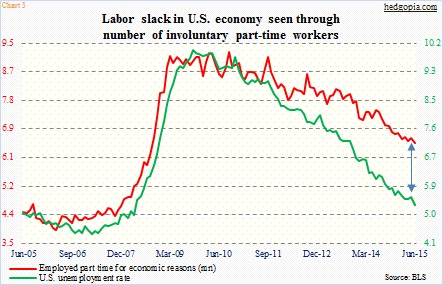
Chart 3 throws some light on the level of potential slack in the economy. The number of involuntary part-time workers was 6.5 million in June. It is at a cycle low, and there is still a sizable gap between the red and green lines in the chart.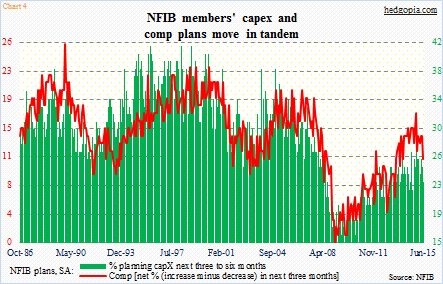
As to the risks posed by Chart 1 and potential pressure on employee wages in the coming months, Chart 4 provides some answers. It pits NFIB members’ comp plans with their capex plans. They correlate well with each other, and recently peaked in December. If companies are not planning on raising capital expenditures, it follows that they have a subdued outlook for the future. As a corollary, this also applies to jobs. By default, this is not a recipe for persistent upward wage pressure. Odds are the three-percent ceiling in the green line in Chart 1 remains as is.
Thanks for reading!
