
Trump trade Tweet-induced selloff in the S&P 500 was bought hand over fist Monday, even as the spike in VIX was sold. Volume was anemic, so there is not much conviction in this – either when the S&P 500 was sold hard early on or when it was bought as the session progressed. Near term, things could go either way.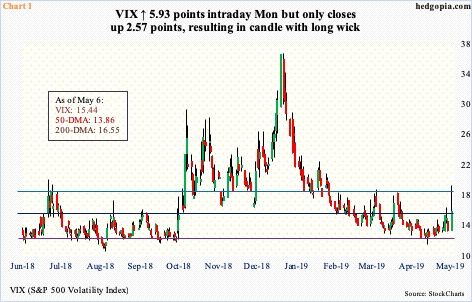
Since US stocks bottomed late December last year, dip-buyers have not had much of an opportunity. There were two in March – in the two-to-three percent range – and both were bought. It is possible Monday’s selloff was treated as such, but it is too soon to say if it will work out the same way. As things stand, things are fluid and could go either way near term.
Overnight Sunday, S&P 500 futures were down over 50 points, before gradually improving. In regular hours Monday, the session low was hit in the very first minute. By close, the index (2932.47) lost 13.17 points – 0.7 percent from last Wednesday’s record high.
How volatility fared is even more interesting.
VIX (15.44) shot up 5.93 points intraday to 18.80, past both the 50- and 200-day moving averages. This was the highest since late January. But as the session progressed, the spike was used as an opportunity to sell, resulting in a candle with a long wick (Chart 1). In the end, the 200-day was lost but the 50-day was saved.
In the past, such spikes have resulted in downside pressure on volatility – at least near term. On the weekly, VIX remains oversold, but the daily not so much. Near term, should the daily prevail, premium comes out of shorter-term volatility faster than its longer-term cousin.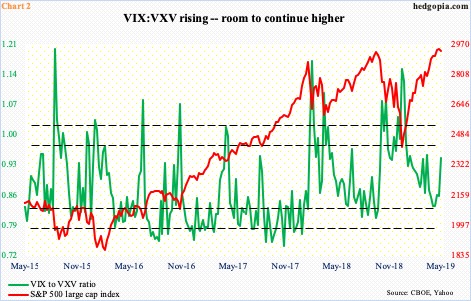
Charts 2 and 3 present interesting dynamics from this standpoint. Both plot the VIX-to-VXV ratio against the S&P 500. VIX measures the implied volatility of S&P 500 index options over the coming 30-day period. VXV does the same but goes out to three months.
In general, stocks tend to fall as the ratio rises from oversold condition, and vice versa. This time around, the ratio bottomed three weeks ago at 0.830, rising to 0.941 Monday. This is what is shown in Chart 2, which uses closing prices. On this basis, there is still room for VIX:VXV to continue higher before it gets overbought.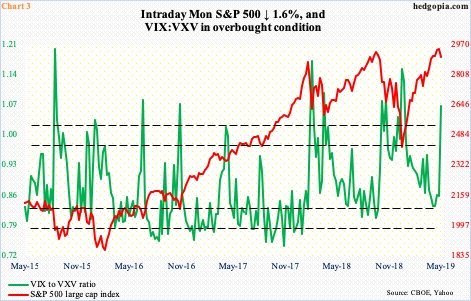
Chart 3, on the other hand, paints a different picture. The difference between Charts 2 and 3 is that the latter uses Monday’s intraday numbers. During the session, the low for the S&P 500 was 2898.21, while the highs for VIX and VXV respectively were 18.80 and 17.73. The ratio, as a result, shot up to 1.06 intraday. On this basis, it already reached overbought territory, hence the possibility of unwinding. Arguably, this may have already begun. By close, the S&P 500 was much higher, and VIX much lower. In a scenario in which this continues, equity bulls can have the upper hand – duration notwithstanding. Dynamics change, however, should VIX’s weekly conditions come out on top, and the daily falls behind. It is a coin toss near term.
Thanks for reading!
