
- Spot VIX has had topsy-turvy ride this month
- First time in three years, hedge funds went net long VIX futures last week
- On three other occasions past five years, this preceded lower VIX in outer weeks/months
The VIX has done quite a round-trip in a short span of time – from 16-plus at the beginning of October to north of 31 by the middle of the month to 16 now. This of course is in lockstep with the move in the S&P 500 Large Cap Index, going from 1946 to 1821 to 1962 during the period. As things stand now, technically the VIX can go either way. Conditions are getting overbought short-term but have room to go lower intermediate-term. The VIX-VXV ratio can still push lower. For nearly three years now, the “fear index” has failed to sustainably close above 21 to 22, even as it has consistently paid off to go long at 10 to 11. 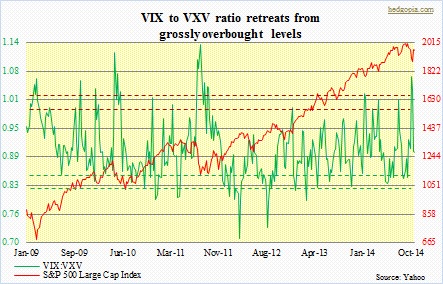
In the midst of all this, there has been an interesting development in the futures market. Large speculators last week switched from net shorts to net longs in VIX futures (grey-circled in chart below). Going back five years, there have been three other occasions this has taken place. In each, the VIX peaked prior to the week in which non-commercials went net long. This time around, it peaked on October 15th, non-commercials went net long the following week. The three other occasions were: (1) November 22, 2011, (2) March 22, 2011, and (3) March 9, 2010. 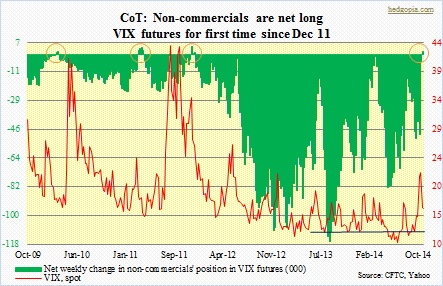
In (1), the VIX peaked on October 4, 2011 at 46.88 (intra-day), was in the low 30s on November 22, 2011, before dropping all the way down to 13.66 on March 16, 2012. Stocks, represented by the S&P 500, responded to this by making a low of 1075 on October 4, 2011 and rising to 1422 on April 2, 2012.
In (2), the VIX peaked at 31.28 on March 16, 2011, was 20.21 on March 22, 2011 and then dropped all the way down to 14.27 by April 28, 2011. The S&P 500, at 1249 on March 6, 2011, peaked at 1371 on May 2, 2011.
In (3), the VIX was 29.22 on February 5, 2010, 18.19 on March 9, 2010 and then dropped to 15.23 on April 12, 2010. The S&P 500 stood at 1045 on February 5, 2010 and then rose to 1220 on April 26, 2010.
Point is, in each of these instances, from the time large speculators went net long VIX futures, spot VIX in due course went lower, which by default meant higher stock prices. Last Tuesday, the reading was 16.08; it closed at 16.04 yesterday. In this scenario, stocks could very well be at least headed toward the September highs. Should this pan out, this would also mean the broken trendline will be retaken. But this is just one possible scenario. It is equally possible the trendline resistance holds and people then begin to buy protection. Action this week and next will probably be a telltale as to where things are headed.
