
- Major U.S. indices approaching/sitting on/slightly under critical technical levels
- U.S. indices give back Eurozone QE gains; key would be if European bourses do so
- U.S. bulls probably swimming against tide for now, but technical damage not irreparable
U.S. equity indices are at critical levels.
It is not just one index, but nearly all the major indices are either approaching a crucial level, sitting on one or have already slightly violated.
It is one thing if one sector begins to act a little tentative, but when a bunch of sectors, or indices, begin to act this way, we need to sit up and notice. Early March last year, when the Russell 2000 small cap index peaked and then went on to suffer nearly 10 percent in nine weeks, it was not confirmed by the S&P 500 large cap index. It was a major divergence – and a big tell – for sure, nevertheless large-caps would not concur. This was back then.
Now things are a little different.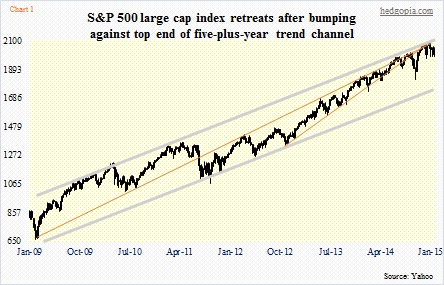
Let us start with the S&P 500 (1994.99). First off, ever since the bull market began nearly six years ago the index has bobbed up and down within an ascending trend channel (Chart 1). When the index hit 2094 intra-day on the 29th of December last year, it was bumping hard against the top end of that. These are always levels where momentum can stop, slow down or even reverse. Off those highs, the index has so far given back 4.7 percent. Perfectly normal in the big scheme of things. Just backing and filling. Only if the index does not suffer further damage, that is.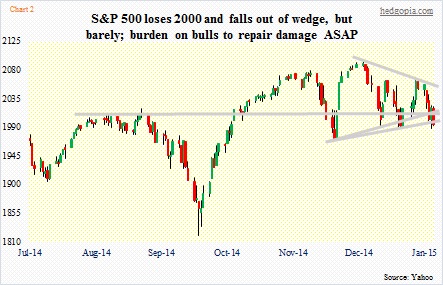
Risks for that occurring are rising. Since that late-December all-time high, the S&P 500 has found itself caught in a wedge (Chart 2). This past Friday, it fell out of that – ever so slightly or convincingly, depending on how one draws a line. This has come even as the index is not able to save the crucial 2000. To be clear, the damage is not irreparable. One nice up day and the index will be above the level in no time. Here is the thing, though. Longer-term, there have been some other noteworthy developments. December was not only a down month but saw a doji/spinning top formation. January was down as well. Both these months traditionally are strong. There is now also a monthly MACD crossover. The 50-day moving average is beginning to curl down.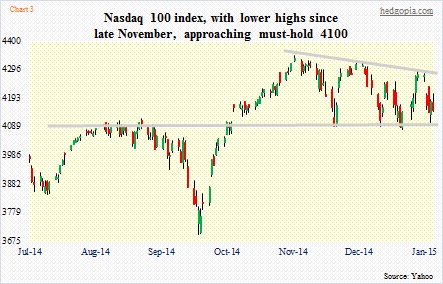
The S&P 500 is not alone. The Nasdaq 100 (4148.43) peaked late November last year, a full month before the S&P 500 did. Since then, the tech-heavy index has persistently made lower highs (Chart 3). The good thing is, the 4100 level, which it earlier broke out of, has since mid-December provided support four times, in the process carving out a descending triangle. It is a sign that demand is waning. Traders are patiently waiting for a move below that level. Once that occurs, they will probably start shorting aggressively.
Over on the Russell 2000 (1165.39), a similar moment of truth lies ahead. After the March peak, the index managed to test it not once but twice – one late June and the other late December. The latter, as a matter of fact, was a breakout, come to think of it, but, as it turns out, a false one. With that, the index has now fallen back into a year-long range (Chart 4). The 200-day moving average is 13 points away, even as momentum is slowing down.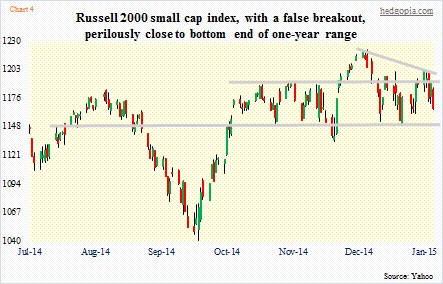
On all these indices, short interest has dropped substantially versus when stocks bottomed mid-October last year – down 37 percent on IWM, down 53 percent on QQQ and down 25 percent on SPY (Chart 5). On some level, this can/should be viewed as positive in the sense that shorts do not expect stocks to go lower. Otherwise, they would attack. But here is an alternative explanation. First, short interest remains high historically. Second, they just got burned. The mid-October trough and the subsequent rally squeezed the heck out of them. Reason why short interest has dropped so much. So they are waiting, and will add to shorts once the levels identified above are convincingly taken out.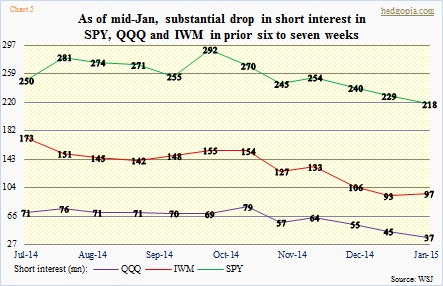
Other indices/ETFs hanging by a thread include SMH, the semi ETF, where 52 is a must-hold (a little over one percent away). It too has been making lower highs for nearly two months now. Ditto with the Dow Jones transports, which has just crossed below the crucial 8700, though barely. One wonders why transports are acting this way even as crude oil has been more than cut in half in seven months.
All this becomes moot if bulls can get their act together and defend/retake these support zones. The damage – or potential damage – has not been beyond repair. One big tell in this respect will come from if and when the major Eurozone bourses will start giving back post-ECB QE gains and trade under. The German DAX (10694.32) is currently 2.4 percent above the January 22nd close, and the French CAC (4604.25) 1.1 percent above. If they cannot build on their post-QE gains, what signal would that send? Would that be interpreted as markets saying QE has reached its limits? U.S. indices, by the way, have already given back those gains, and then some.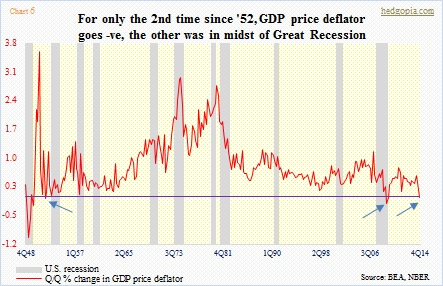
That rhetorical question has already found its answer when it comes to inflation. Despite $4tn the Fed created post-financial crisis, inflation is a no show. In 4Q14, the U.S. GDP deflator dipped in the negative territory (Chart 6). Outside of Great Recession, this is the first time since 1952 it fell quarter-over-quarter. Asset prices on the other hand have always responded positively to QE. Both in the U.S. and Japan, they inflated post-QE. Eurozone equities are expected to react the same way. If they don’t, that would represent a sea change.
The bottom line: bulls do not have much room for error this week. If they cannot regroup, bears will growl.
