
- 2014 on track for 3rd successive year of $300bn-plus high-yield issuance; energy 15% of junk market
- By not cutting 30mn bpd production target, OPEC ready to lock horns with shale oil
- As both sides play game of ‘who will blink first’, risks of casualties rise
For a while now, high-yield corporate bonds have diverged from stocks. They (Chart 1, represented by HYG) first peaked in June, then in August and then again in October. Each high was lower than the prior one. The S&P 500 Large Cap Index in the meantime never missed a beat – a succession of higher highs. As have been discussed previously, stocks in general have also diverged from long bonds. It is healthy if they moved in sync. But at present, bonds are not in agreement with the hunky-dory message coming out of stocks. In normal times, junk bonds tend to act more like stocks than their higher-grade brethren. They have higher yields and shorter maturities. Their fate is tied more to the fate of the company that issues them. In other words, the pricing behavior of these bonds could be a reflection on the overall economy. In the past, sustained underperformance by junk bonds has tended to be a canary in the coal mine. The fact that they are lagging the overall market is a telltale sign of jitters under the surface.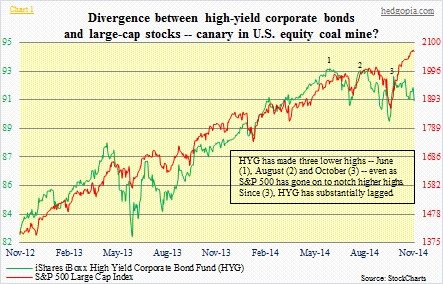
U.S. junk-bond issuance has absolutely gone through the roof (Chart 2). The previous high in high-yield issuance was in 2006 – $146.6bn. As Great Recession hit, issuance fell off the cliff, to $43bn in 2008. Since that low, it has been nothing but sunny/sunnier skies – 2014 is on track for a third consecutive year of $300bn-plus issuance. Cumulative issuance the past six years is on pace for $1.6tn. To be fair, this bonanza in corporate-bond issuance is not limited to just high-yield. At the current pace (as of October), U.S. corporations would have issued $1.5tn this year. This would be the fifth consecutive $1tn-plus year. But high-yield is high-yield. It is riskier. There is a reason why “high” yields are demanded of these companies. Nonetheless, their popularity is a reflection on the current complacent investing climate and investors’ propensity to get on the risk curve.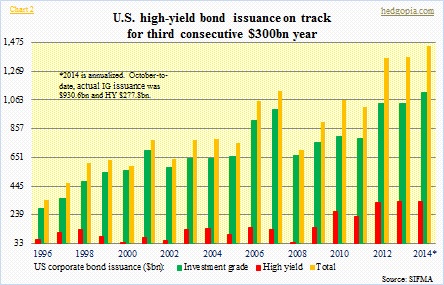
Energy is one of the sectors that have cashed in on this sentiment. U.S. shale oil and the promises it carries have attracted lots of money. As early as 2004, the energy sector made up less than five percent of the Barclays U.S. Corporate High Yield Bond Index (Chart 3). Then it progressively swung higher, to north of 15 percent (as of October 17th). The U.S. junk-bond market is $1.3tn strong. Any time a sector gets to be this large it is time to be not just asking what has gone right but what could go wrong. Why? Because things looked very promising when crude was north of $100/barrel. Metaphorically speaking that was yesterday. Today is different. How long oil prices remain low will have repercussions across currencies, national budgets, corporate capital-spending plans and energy shares. If crude shoots back up tomorrow toward $100, the issue becomes mute. In fact, that is probably what would have happened if the OPEC agreed last week to a cut in its production target. Now that that did not happen, it is logical to be focusing on the likelihood that oil stays under pressure. The longer the durateion, the higher the odds that the aforementioned junk bonds come into play. In a way, one can argue that the lagging HYG has already made it clear – that pain lies ahead.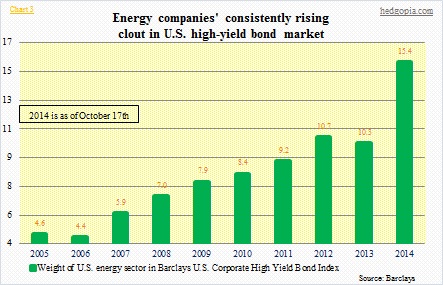
First of all, crude has dropped as a result of both weak demand and excess supply. The world consumes 92mn barrels/day. From Europe to China, economies have softened. In the meantime, there is upward pressure on supply. Experts put excess production at around 1mn bpd. Thanks to the shale revolution, U.S. production is nearly neck-and-neck with Russia and Saudi Arabia. So it is a double whammy – both demand and supply acting together. We are already beginning to hear commentary about how the collapse in crude is a leading indicator and that the U.S. is headed for a recession. Maybe so, maybe not. Once again, it is not just demand that has caused the collapse in crude. At the turn of the century, crude (WTI) led the 2001 recession, but in the subsequent Great Recession it behaved coincidentally. Gasoline, however, peaked after the recessions had already gotten underway (Chart 4). So if anything, signals are mixed. There is this, though. The slope of the current drop has similarities to the one that began in July 2008.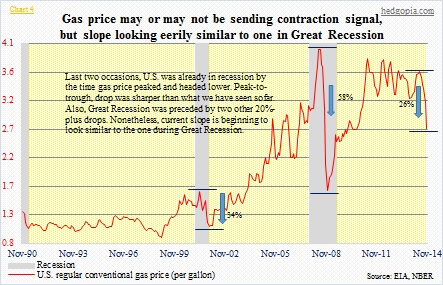
Interestingly, even with all the investments shale oil has attracted, the number of U.S. refiners has consistently shrunk, with minimal idle capacity. From April to September this year, utilization of refinery operable capacity was in the low 90s. Notice the trendline drawn on the WTI (Chart 5). Besides being a commodity, crude is also a financial product, and sentiment can play a role here if that breaks. In terms of breakeven price, there have been all kinds of numbers thrown around. IHS says that the median North American shale development needs crude price of $57 in order to break even; this was $70 last year. Most of the growth in shale is in the Bakken, Permian Basin and Eagle Ford, and they happen to be lower-cost. If IHS’s $57 breakeven is right, shale production will stay put – at least a good portion of it – for now. As far as new investments are concerned, it is only probable that they will be cut. We would not know what kind or how much until January/February when companies disclose their 2015 plans. Means there will be no meaningful cuts for the next several months. This is one side of the coin.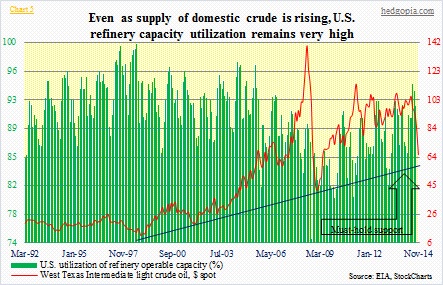
The other side is the OPEC. It has already thrown down the gauntlet. By maintaining the 30mn bpd production target, it is seeking to ensure: (1) marginal shale players are wiped out, and (2) the world economy gets much-needed help. Sky-high oil prices would both crimp demand and encourage more exploration/production. A sustained drop in oil – or even if it stays around here – has the potential to pose political/budget risks for several countries. Several OPEC member nations excessively rely on petroleum exports, and only a few of them have healthy reserves (Chart 6). For several of them, fiscal break-even prices are much higher than where oil is trading. Be that as it may, Saudi Arabia, the big daddy, is sitting pretty with massive reserves. And it can wait. (Non-OPEC Russia hurts, too, but has reserves of well north of $400bn.) In a worse scenario, producers, already feeling the pinch from lower prices, might try to offset lower revenues with production increase. The IMF recently said Iran would need $136/barrel to balance its budget, and Venezuela and Nigeria $120 (Russia $101). 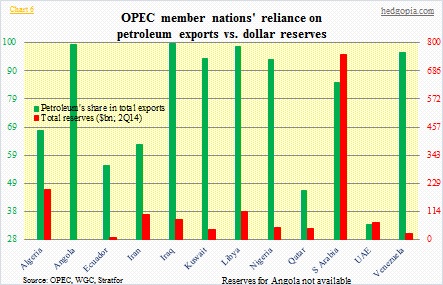
The bottom line: both sides probably believe that they have cushion to fall back on. The longer they lock horns, the higher the odds of casualties. In this scenario, high-cost shale plays, and the junk bonds that funded them are in play. HYG has been trying to send that message since June, and that was when the WTI peaked before the rout began. Helmets and seat belts, please.
