
Even as options traders continue to remain complacent but doing so are minting money, non-commercial futures traders just turned bearish on tech shares. Amidst this, some early signs of fatigue are showing up in small-caps, although cash keeps setting new highs.
In the options market, sentiment continues to push further into overbought territory.
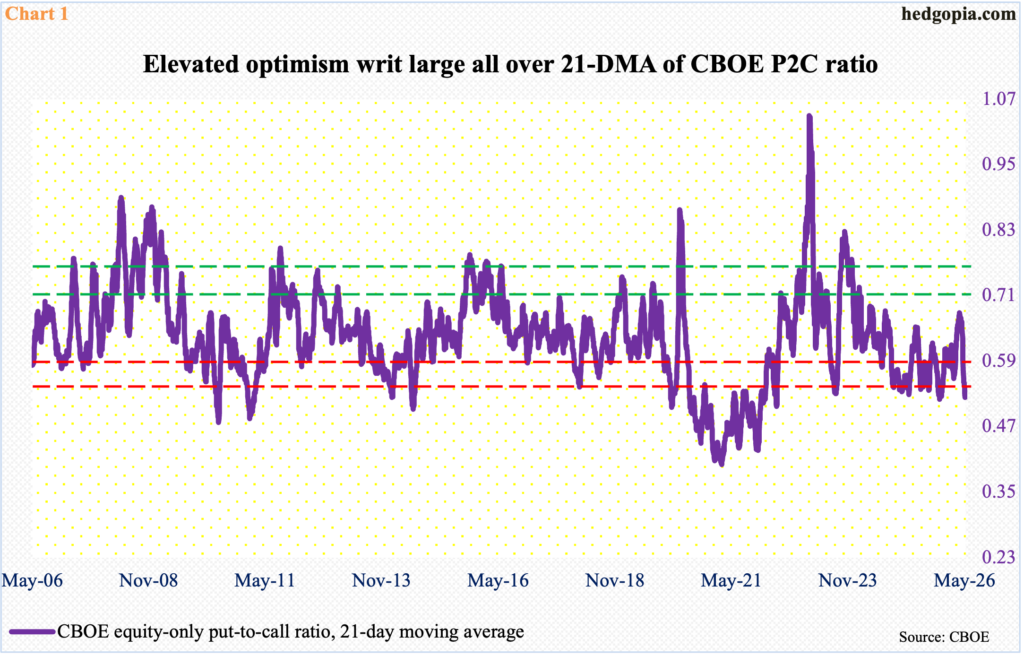
For 18 consecutive sessions at the end of last week, the CBOE equity-only put-to-call ratio produced readings of 0.50s or lower, eight of them in the 0.40s. The 21-day average of the ratio came in at 0.523 on Friday, which was the lowest count since mid-October last year.
This is complacent territory. If past is prelude, this lop-sided behavior gets unwound sooner or later. That does not, however, preclude the 21-day average from going lower still. It has in the past (Chart 1). But with each move lower from hereon, risks would have risen for the longs – the new ones in particular.
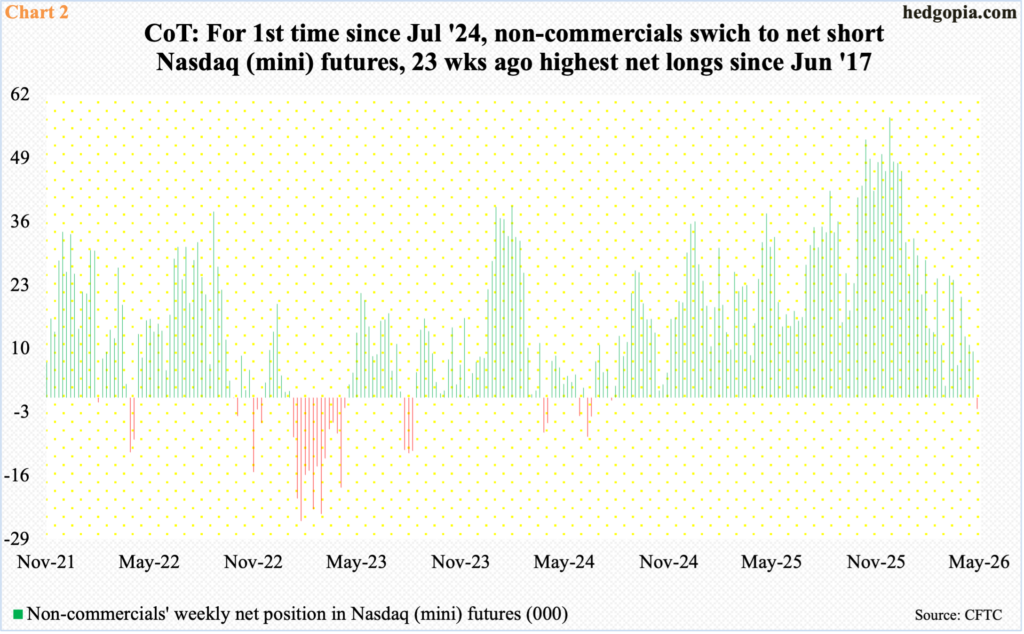
Elsewhere in the derivatives market, non-commercials for the first time in nearly two years switched to net short Nasdaq (mini) futures as of last Tuesday. They were sitting on 2,322 contracts, which is miniscule in the big scheme of things, but the reality is that they have been reducing their net longs since the week to November 25 last year when they held 57,393 contracts, which represented the highest net longs since June 2017 (Chart 2).
Most recently, in the week to March 10, these traders were net long 24,929 contracts. The major US equity indices bottomed on March 30; as the cash rallied, non-commercials gradually reduced their bullish exposure, which has now turned into slightly bearish.
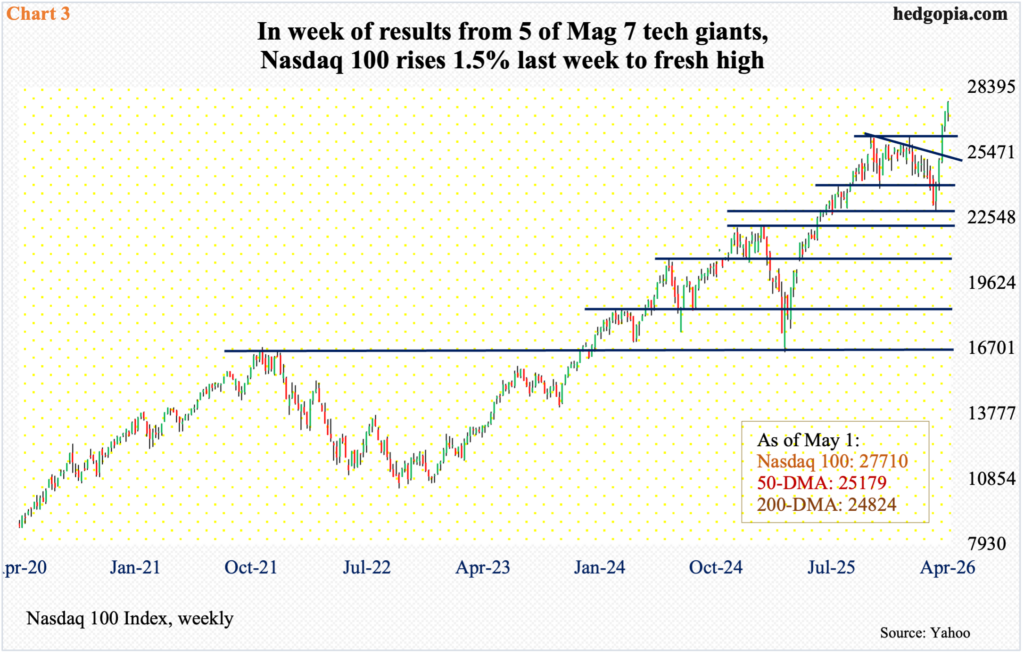
Cash traders in the meantime have done very well doggedly staying on the long side. Last week, the Nasdaq 100 added 1.5 percent to 27710, with a new all-time high of 27787 registered on Friday (Chart 3). Through that high from March 30 when it bottomed at 22,841, the tech-heavy index is up 21.7 percent!
Last week, investors reacted to March-quarter numbers from five of the Magnificent Seven – Apple (AAPL), Google parent Alphabet (GOOG), Amazon (AMZN), Facebook parent Meta (META) and Microsoft (MSFT).
Despite how overbought the Nasdaq 100 is currently, unless tech bulls fail to defend breakout retest at 26100s, it has paid off to remain in full risk-on mode since the March 30 low. Thus far, there is not a hint of distribution.
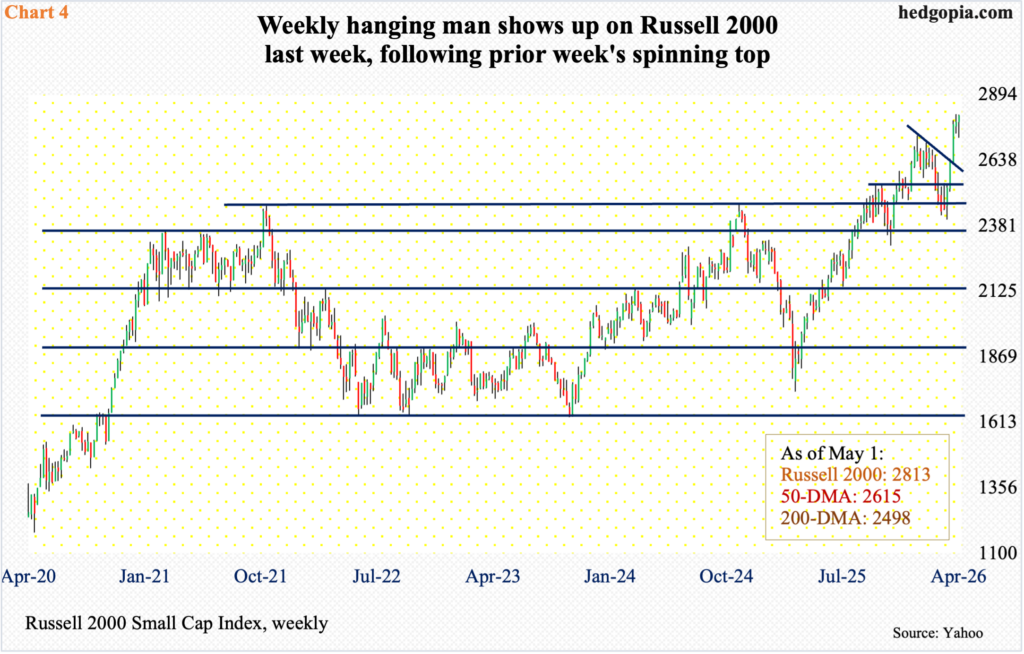
Small-caps, however, acted a little tentative last week. The Russell 2000 recorded a fresh closing high of 2813, up 0.9 percent for the week, but at the same time Friday’s intraday high of 2816 failed to surpass the prior week’s all-time high 2818 by two points.
More importantly, a weekly hanging man formed last week. This follows a spinning top from the prior week (Chart 4). These candles need confirmation, but signs of fatigue are showing up after five consecutive up weeks, having bottomed on March 30 at 2405.
For consolation, bulls succeeded last week in defending a breakout retest at 2730s. Earlier, on January 27, the Russell 2000 peaked at 2735, before posting a series of lower highs. This trendline resistance was broken three weeks ago, and this preceded a breakout at 2540s in the week before.
As things stand, 2730s represent a make-or-break level.
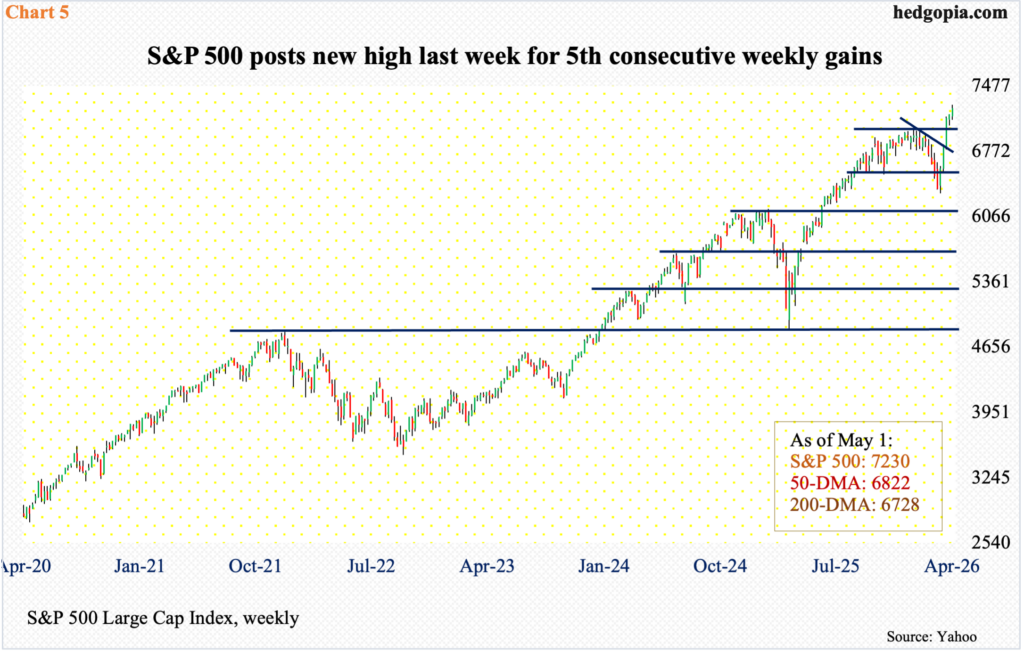
On the S&P 500, a similar level of import lies at 7000, or just south of it. Last week, the index rose 0.9 percent to 7230. This was a fifth consecutive weekly rally, having bottomed at 6317 on March 30, rallying 15 percent through last Friday’s intraday high of 7273.
Bulls are probably not happy how Friday evolved, though, having given much of the gains, producing a dreaded shooting star on the daily. But the weekly candles look just fine. It is just that the bulls need to make sure Friday’s shooting star is a one-off and not the beginning of a new downtrend. If this candle gets confirmed this week, then buying interest can appear at 7140s, followed by 7050s and the all-important 7000 (Chart 5).
Since the March 30 lows, bulls have persistently ignored the bad news and latched onto the good ones.
Of note, Israel and the US launched an attack on Iran on February 28. On the 27th, West Texas Intermediate crude closed at $67.02/barrel and the S&P 500 at 6879. By March 9, the crude ticked $119.48 intraday and closed last week at $101.94. This jump in oil prices did negatively impact the S&P 500 initially as it dropped to 6317 by March 30 but only to then gradually take out its old highs to newer highs.
Bulls are obviously hoping that the Middle East conflict resolves soon and that oil prices begin to head back lower. The risk in this is that the longer the status quo persists, the higher the odds of a long-lasting damage to the economy.
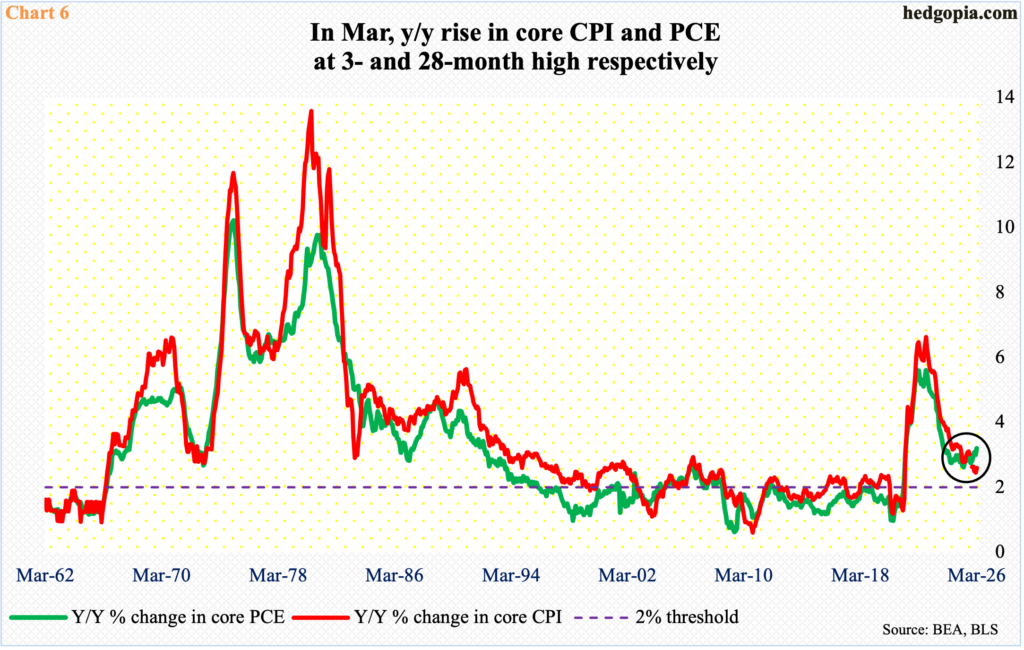
Inflation already is a percentage point higher than the Federal Reserve’s desired goal of two percent. In the 12 months to March, core CPI (consumer price index) and PCE (personal consumption expenditures) increased 2.6 percent and 3.2 percent, in that order. Core PCE – the Fed’s favorite – has stayed north of three percent for three straight months, with the March reading at a 28-month high (Chart 6).
As the March-quarter earnings reporting season winds down, investor attention may begin to focus on how inflation is likely to behave in the months and quarters to come.
Thanks for reading!
