- Bulls squander opportunity by failing to defend Tuesday’s lows on S&P 500 and Dow
- Put-to-call ratios just turning up, and have ways to go before they get overbought
- VIX surges 57% in three sessions; investors seek to protect 2014 paper gains
There we have it. OPEC is not budging. On the sidelines of an annual U.N. climate change conference in Peru, Saudi Oil Minister Ali al-Naimi was asked whether it would be necessary to reduce oil production prior to OPEC’s next scheduled meeting in June. His response? “Why should we cut production? Why?”
This is despite the fact that the 12-member organization is lowering next year’s demand forecast. It now predicts demand for OPEC oil would drop to 28.9mn barrels a day next year, down from 29.4mn barrels a day this year.
Also yesterday, the Energy Information Administration informed us that U.S. oil inventories rose by 1.5mn barrels in the week ended December 5. The consensus was for a decrease in supplies of around 3mn barrels.
This points to a clear imbalance between demand and supply. With the major parties having put their foot down, now it is up to the market to find the equilibrium. And it is doing exactly that – by pushing prices lower. Not sure if this is what is causing jitters in the stock market. Or maybe everyone was already positioned for a seasonally favorable December, and there was no one left to buy.
The failure yesterday by both the S&P 500 and the Dow to hold Tuesday’s lows probably does not bode well at least near-term. (Though this did not occur on the Nasdaq Composite.) We are beginning to hear oil-induced cuts in capital expenditure plans, like by BP yesterday. Earnings expectations for S&P 500 energy companies for the fourth quarter are now a negative 14.6 percent; late-September, the consensus was for growth of 6.6 percent (courtesy of FactSet).
Given all this, it is perhaps apt to turn our attention towards the options market for signals.
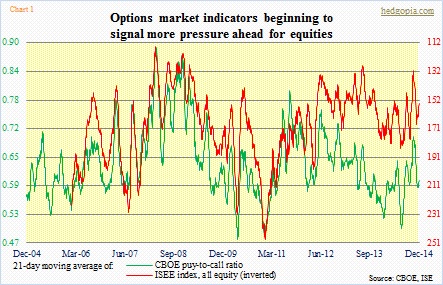
Chart 1 shows the CBOE put-to-call ratio and the ISEE index, all equity (latter is inverted as it is a call-to-put ratio). As can be seen, both have curled up. More often than not, once that process begins, they continue in that direction until they get overbought. There is a ways to go before that happens.
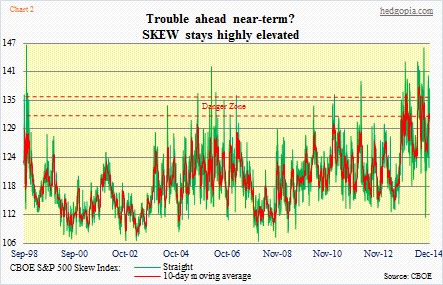
SKEW continues to stay elevated – in the 130s in 10 of the last 14 sessions. SKEW is similar to VIX in that both are calculated from the prices of S&P 500 out-of-the-money options. The difference is that the former attempts to measure tail risk. As market participants expect trouble ahead, their demand for low-strike puts goes up, putting upward pressure on SKEW. Its value ranges from 100 to 150. As shown in Chart 2, both the straight number and the 10-week average are currently elevated, and can cause trouble for equities in the right circumstances.
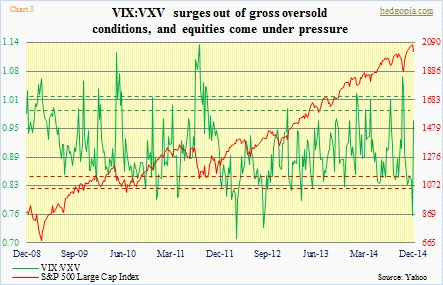
That is what the VIX to VXV ratio was signaling as early as this past Friday. The ratio stood at .76 that day, lowest since mid-August 2012. And look at that surge in three days (Chart 3)! The ratio rises when there is more demand for near-term protection. And it is probably not done going up. One thing to look out for is if and when the VIX spikes and then sells off. Yesterday’s was a long white candle. There is a sudden increase in demand for protection – probably because the majority does not want to cash in on gains until the year is out, yet is not sure what lies ahead the next three weeks.

