The following are futures positions of non-commercials as of February 17 (Tuesday). Change is week-over-week.
10-year note: The 10-year yield had been trending down within a channel since it peaked on December 30, 2013 at three percent. Early this year, it fell out of it and in no time lost 50 basis points. The strong rally of the past three weeks has seen it push its way back into the channel. If it continues to inch higher, how it acts around 2.34 percent will be a good tell as to the durability of the prevailing selloff in the notes. As shown in the chart, that area amalgamates two different levels of resistance.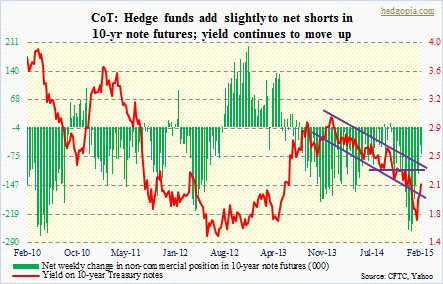
Non-commercials, in the meantime, are trying to make up for lost dollars. They began to reduce what were otherwise massive net shorts seven weeks ago even as the notes began to come under pressure. Now that they missed out on that and as the yield has continued to move up, they added a little this week. Currently net short 67.2k, up 22.4k w/w.
30-year bond: The 30-year yield added another 11 basis points in the week. A couple of things need consideration. (1) In September and November last year, the yield experienced a similar move higher. Momentum indicators such as the CCI, stochastics, and the RSI are currently approaching the middle of the range. Back then, momentum stopped right here. So depending on what happens next may give us clues as to if there has been some kind of a shift in supply-demand dynamics. And (2) it is comfortably above the important 2.55 percent, but major resistance lies overhead – at 2.9 percent.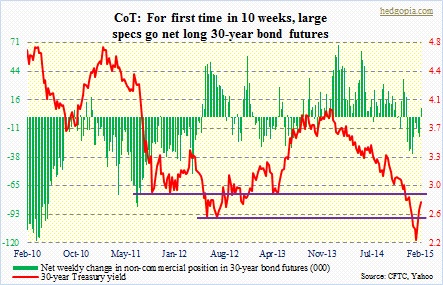
Even as the yield faces this hurdle, non-commercials are beginning to go net long – first time in 10 weeks. Let us see if they get it right. Currently net long 8.5k, up 27.1k.
Crude oil: The count is now 13. That is the number of sessions the WTI has stayed underneath $53.50-$54. Tuesday, it got to $54.15 intra-day but closed at $53.24. For the week, the WTI lost 3.7 percent, but these traders added to their net longs. Tuesday was an up session. So it will be interesting to find out how they may have reacted to the drop in oil in subsequent sessions.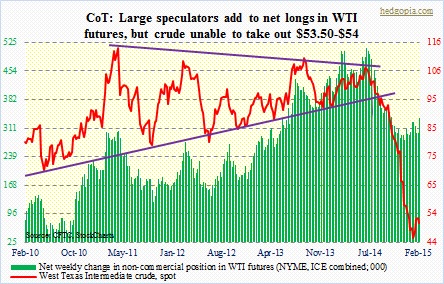
In the near term, crude is itching to go lower. We would be probably looking at a different picture if that resistance got taken out. That has not happened, and momentum is weakening. In the meantime, contango continues to be deep, with September at $56.83 and March (next year) at $60.17. Currently net long 336.1k, up 38.4k.
E-mini S&P 500: Non-commercials are not exposed enough. After having reduced from over 170k net longs in the first week of January, they have now only added 16k contracts the past three weeks. This during a period in which the S&P 500 large cap index has appreciated 5.8 percent. We will find out next week if and how they reacted to the Greek development Friday afternoon. Stocks reacted very well. In fact, having early in the session bounced off of its 10-day moving average, the index went on to score an outside day. Daily indicators are way oversold, but there is room for bulls to squeeze out shorts. Intermediate-term indicators are yet to get overbought. Currently net long 93k, down 4.5k.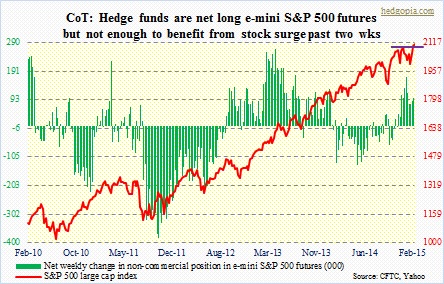
Euro: Essentially went sideways for the week – not a bad thing given the kind of pressure it had been under since March 2014. FXE has gone sideways the past four weeks. This gives the averages enough time to go sideways, and then possibly hook up. On a daily chart, in fact, this is exactly what seems to be occurring. There is a slight 10/20 crossover. At this juncture, any news – real or perceived – can do the trick. Friday’s Greece news did that to some extent, as it reversed early weakness. Non-commercials, on the other hand, are not even remotely worried. They continue to hold massive net shorts. Currently net short 185.6k, down 9k.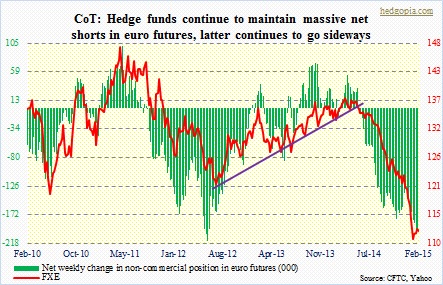
Gold: The 1,180-1,200 support has held – for now. Intra-day Wednesday, it did drop below 1,200, but that was quickly snapped up. But this may not be the last time the metal would have tested 1,200, or even lower. Weekly indicators have room to come under more pressure. As can be seen, it is literally sitting on that support. And it is a descending triangle. Non-commercials have been slowly unwinding their net longs. But positions are still substantial. The risk facing the metal is that even if it manages to rally here, sellers will appear at 1,230-1,250. Currently net long 131.7k, down 23.6k.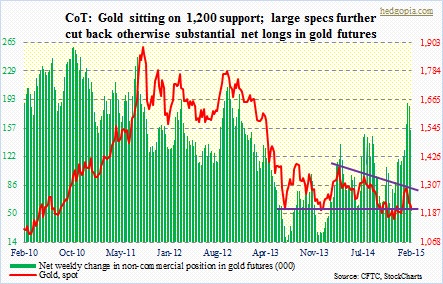
Nasdaq 100 index (mini): These traders are finally acting. Over the past couple of weeks, net longs have gone up by 30k. The index broke out of a triangle last week. So the trend followers are jumping on board. It is possible they added more Friday post-Greece news. We will not find out until next week. In the meantime, the NDX has notched a new closing high. On an intra-day basis, the index is still nearly eight percent below the March 2000 peak, but on a closing basis it is at a new high. This thing can drop 100 points and still be fine, assuming it finds support where it broke out of last week. Extended? Absolutely. It has added 350 points in three weeks. But there are no signs of distribution yet. Currently net long 50.1k, up 20k.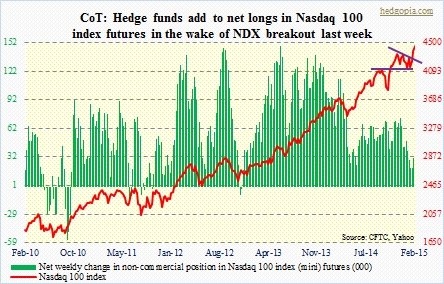
Russell 2000 mini-index: The Russell 2000 small cap index was another to have seen an outside way on Friday. (IWM, too, found support at its 10DMA to shake off morning weakness.) In the process, the index was able to poke its head out of the multi-month wedge. A convincing break out of this formation would be a major development. Last year, small-caps lagged their big-cap brethren. Several strategists are on record saying it is small-caps’ turn this year. But price action so far is not that convincing. And non-commercials continue to look the other way. Currently net short 29k, down 4.6k.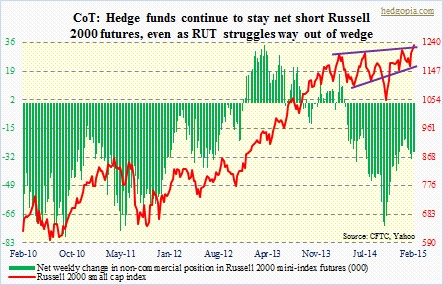
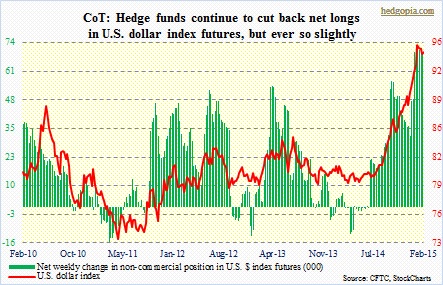
U.S. Dollar Index: The next major move for the dollar is likely be on the downside. After the kind of move it has had since July last year, it is not uncommon for fatigue to set in. We are beginning to see some signs of that on a weekly chart. For the week, the index was essentially unchanged, and has been range-bound between 94 and 95 the past four weeks. So far the red line and the green bars on the right side of the chart are moving in tandem. The index has come under a little bit of pressure, as have non-commercials’ net longs. But the latter is still sizable. A lot of unwinding to do if the dollar comes under genuine pressure. Currently net long 66.1k, down 2.8k.
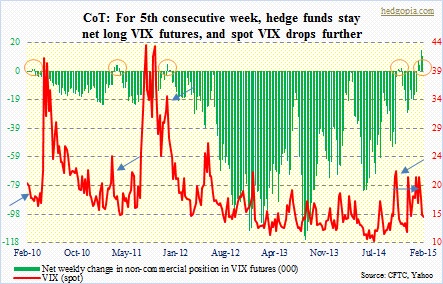
VIX: For over two years now, spot VIX has found it tough to sustain above 22-23. This time was no exception. Since the intra-day spike on February 2nd, it has lost 8.5 points. Daily indicators are grossly oversold, but in the near-term weekly indicators may just win out, which have room to go on the downside. It has lost both its 200- and 50-DMA. Weekly indicators suggest more pressure lies ahead. In the meantime, non-commercials have stayed net long for five consecutive weeks now. What a contrarian signal this is turning out to be! Refer to the blue arrows and corresponding orange circles in the chart. Currently net long 7.4k, down 3.1k.