
Volatility bulls failed last week to hang on to Monday’s spike, even as non-commercials are actively reducing net shorts in VIX futures. This is taking place at a time when large-cap indices are trading just above the 200-day, and small-caps are right at make-or-break horizontal support.
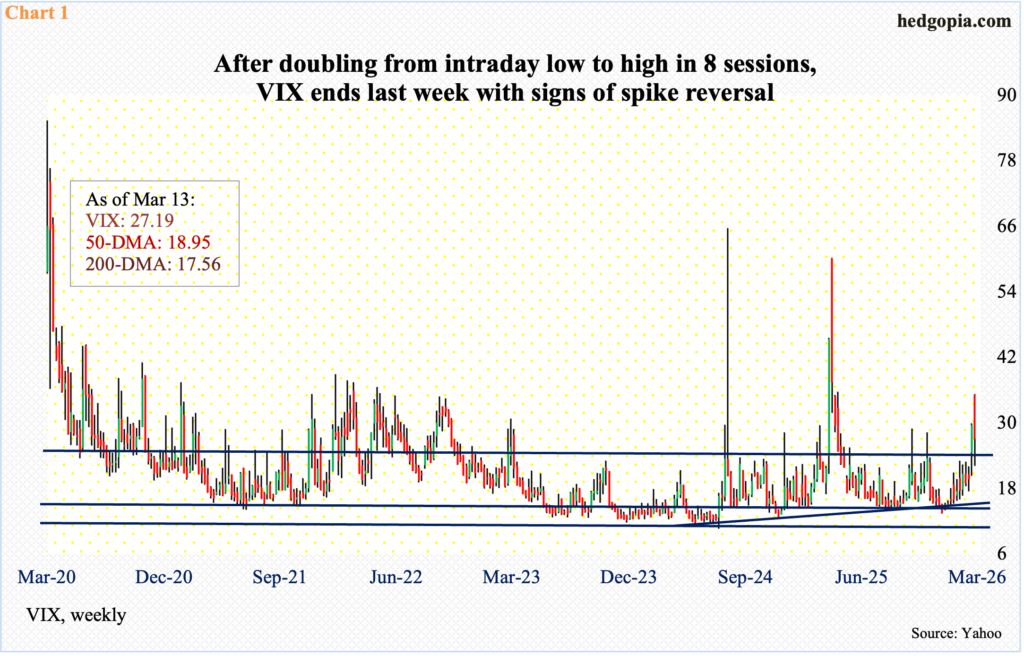
From intraday low to high, VIX doubled in eight sessions. Tagging 17.50 on 26 February, it touched 35.30 last Monday, although volatility bulls failed to keep that high, with the session reversing lower to close at 25.50. By Friday, VIX lost 2.30 points for the week to 27.19. This was the first down week in three, and second in nine (Chart 1).
VIX has risen all along a rising trendline from Christmas Eve when it ticked 13.38 intraday. This support gets tested around 19. If it turns out last week’s is a spike reversal, volatility can subside in the sessions ahead – duration and magnitude notwithstanding.
On the monthly, VIX acts as if it is headed a lot higher. But near-term is another matter, given the move the volatility index has had in a short period of time. Speaking of which, weekly RSI is turning lower after kissing 70.
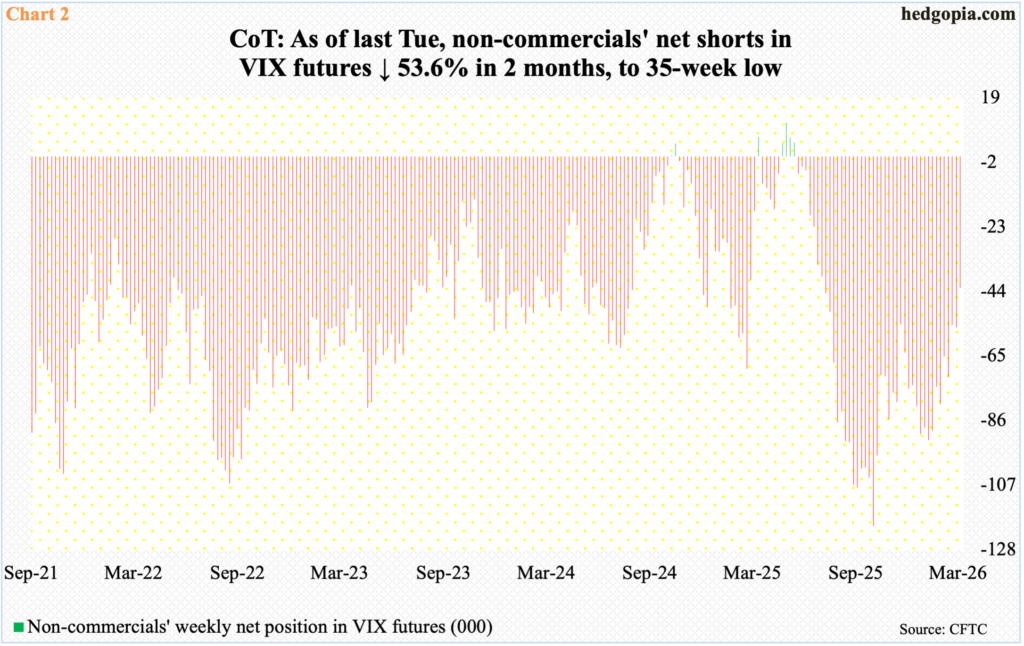
Amidst this, in the futures market, non-commercials are actively cutting back on their holdings of net shorts in VIX futures, to 42,835 contracts as of Tuesday, down from 71,817 as of 17 February and 92,363 as of 13 January (Chart 2).
In the past, these traders have tended to either go net long or get close to doing that before the spot peaks. Their activity is worth watching.
VIX’s behavior last week is coincidental with signs the major equity indices are readying themselves for a relief rally.
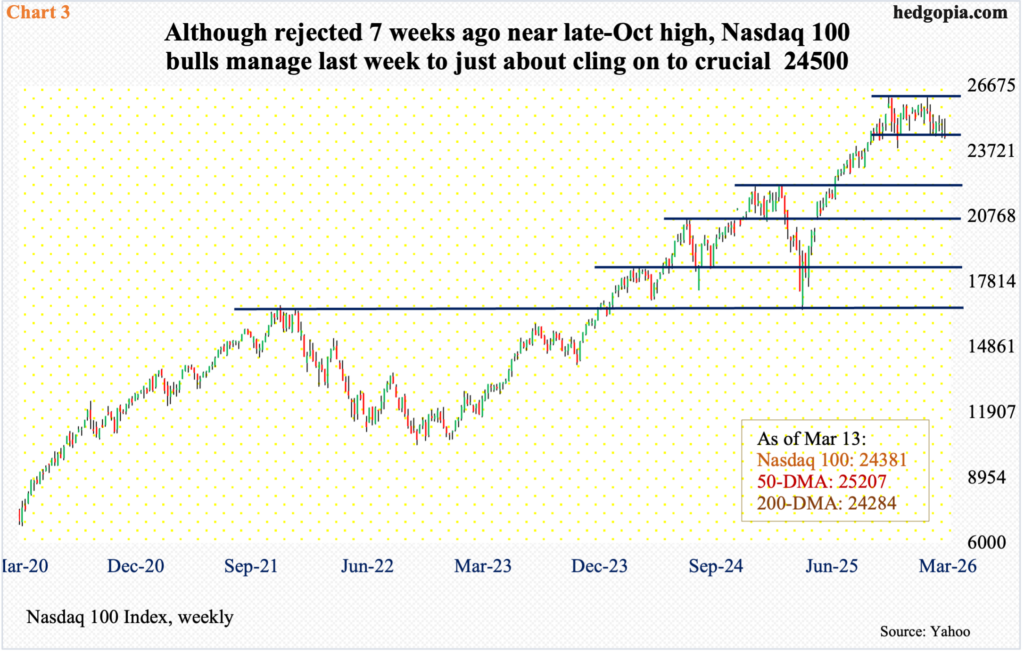
The Nasdaq 100 last week dropped 1.1 percent to 24381, having peaked on 29 October at 26182 and then coming within 17 points of that high on 28 January. Since that double-top, the tech-heavy index proceeded to lose the 50-day moving average early last month and is just above the 200-day (24284) currently. It has been above the 200-day for 10 months now – sideways just above the average since early this month.
Last week’s gravestone doji on the weekly follows back-to-back spinning tops. There is a long way to go on the downside on the monthly. Amidst all this, horizontal support at 24500 was breached last week but not by a whole lot (Chart 3).
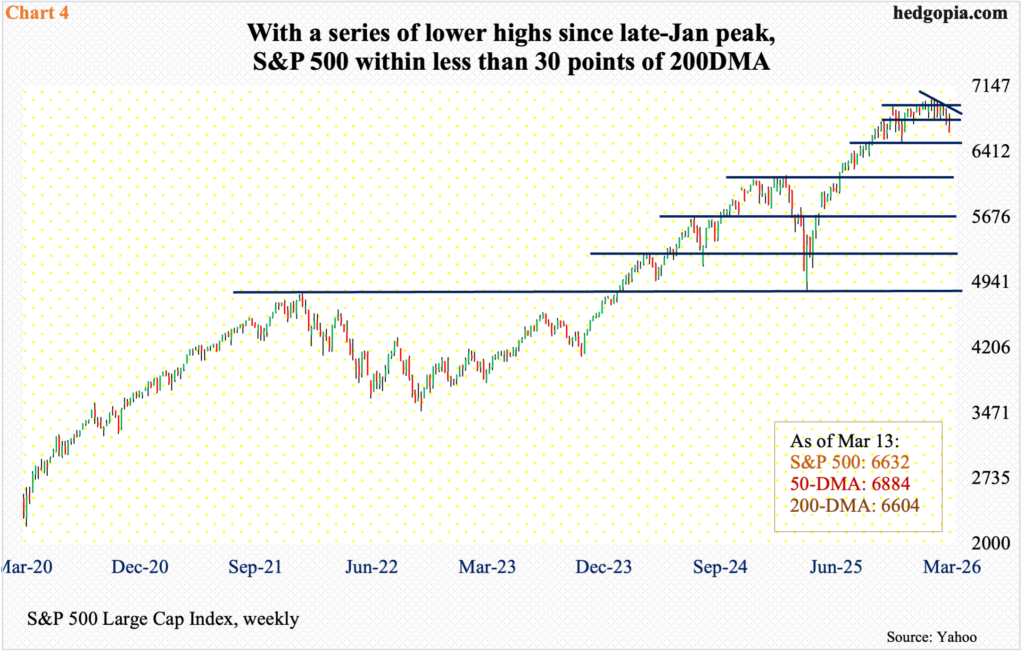
The S&P 500, too, finished last week just above its 200-day (6604). Down 1.6 percent to 6632, it closed right at lateral support at 6630s.
The large cap index peaked at 7002 on 28 January and has since made a series of lower highs. Last week, a shooting star showed up on the weekly (Chart 4).
Mid- to long-term, the monthly has just begun to unwind the overbought condition it is in. From last April’s low of 4835, the S&P 500 rallied a ton before giving out signs of fatigue.
That said, the 200-day has not been tested since last May and is unlikely to give way on the very first test. A breach of the average can open the door toward horizontal support at 6550s.
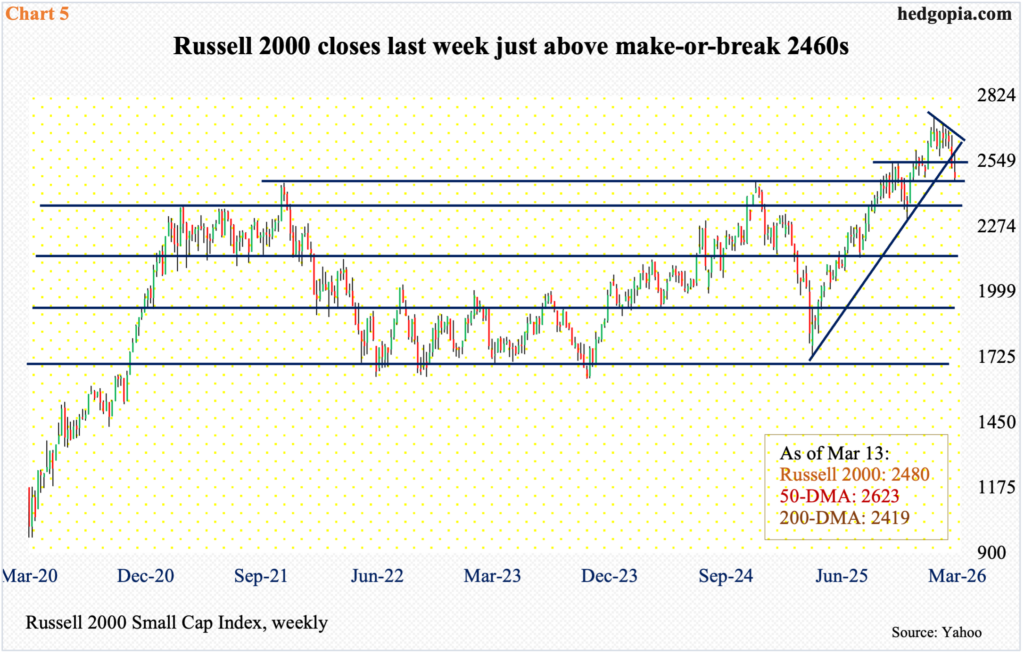
The Russell 2000 similarly has approached a crucial level. On 22 January, it peaked at 2735, before making a series of lower highs, followed by a loss of crucial support at 2540s. Last week, another crucial support was tested.
In November 2024, the small cap index retreated after ticking 2466. Three years before that, in November 2021, it rose to 2459 and then went the other way. Last September, those highs were surpassed, but not before a stretched bull-bear tug of war followed around those highs, hence the significance of 2460s (Chart 5).
Last Monday, the index tagged 2463 intraday, closing the week at 2480, down 1.8 percent for the week. Failure to save 2460s will raise the odds the index will at least gravitate toward the 200-day at 2419. It is already under the 50-day at 2623.
Thanks for reading!
