
Last Monday, major equity indices all opened up strong but by Friday they diverged. Small-caps led, while tech lagged. Despite this, they all closed out the week at/near resistance. Breakout will further push them into extended territory. A breather is due.
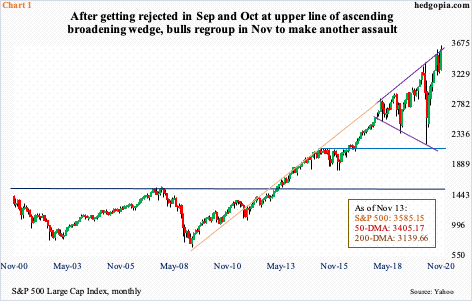
Last week started out strong. On Monday, the S&P 500 gapped up, rallying to a new intraday high of 3645.99. At the session high, it was up as much as 3.9 percent – well past the September 2nd high of 3588.11, but this was used as an opportunity to sell; in the end, the large cap index only managed to rise 1.2 percent. The volatile session produced a shooting star.
When it was all said and done, the S&P 500 rallied 2.2 percent last week, ending at 3585.15, essentially testing the September 2nd high. Monday’s intraday high tested the upper line of a nearly three-year-old ascending broadening wedge. After getting rejected in September and October, bulls have managed to regroup to once again test the resistance (Chart 1).
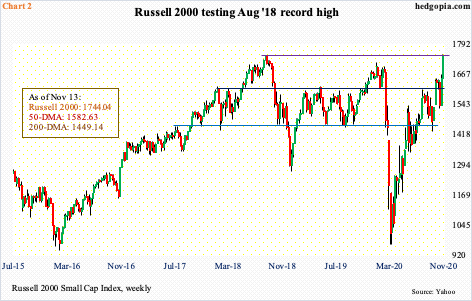
The Russell 2000, on its part, is testing its prior high from August 2018 when on the 31st it posted 1742.09 before retreating. In four of the five sessions last week, the small cap index hit 1740s, with a new high of 1749.36 on Friday and the session ending at 1744.04 (Chart 2).
Small-caps have come to life the past couple of weeks, rallying 13.4 percent.
In the week of the election, investors gravitated toward these stocks as it became clear that President-elect Joe Biden would emerge victorious. Then came last Monday’s Pfizer news that said the company’s coronavirus vaccine was more than 90 percent effective. If this first analysis holds up, then mass vaccination can begin in the US next year, which would mean the economy can begin to get back to normal.
In this scenario, small-caps can benefit more versus their larger-cap brethren. By nature, small-caps have larger domestic exposure. Large-caps are also exposed internationally.
Leading up to this latest divergence, tech led big time. For the year, the Nasdaq 100 is up 38.5 percent, versus 11 percent for the S&P 500 and 4.5 percent for the Russell 2000. Small-caps in particular were shown no love. If the domestic economy begins to sustainably recover, this could change.
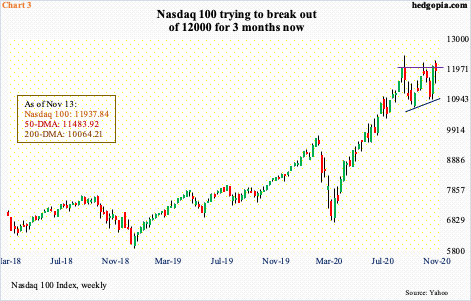
Last week, the Russell 2000 jumped 5.8 percent, while the Nasdaq 100 gave back 1.3 percent. The latter opened strong on Monday, but the strength was sold. At least last week, there was a clear preference for value at the expense of growth. And with that, once again the Nasdaq 100 (11937.84) failed at 12000, which it has tried to take out for the past three months (Chart 3).
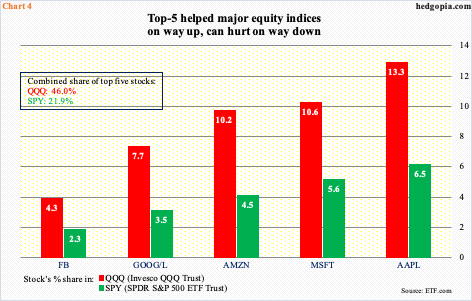
Tech matters. The five largest US companies are all tech. Apple (AAPL), Microsoft (MSFT), Amazon (AMZN), Alphabet (GOOG/L) and Facebook (FB) combined make up 46 percent of QQQ (Invesco QQQ Trust)/Nasdaq 100 and 21.9 percent of SPY (SPDR S&P 500 ETF)/S&P 500 (Chart 4).
They provided a massive tailwind to the market cap-weighted indices on the way up and will provide a headwind on the way down, assuming tech continues to lag.
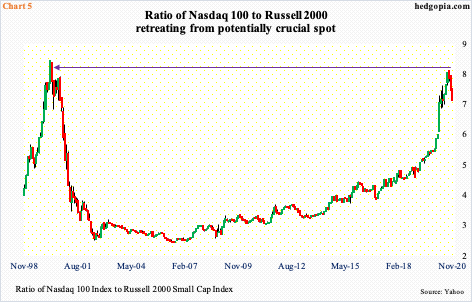
In this scenario, the ratio of the Nasdaq 100 to the Russell 2000 becomes relevant. And it just retreated from a potentially crucial spot.
The ratio reached its highest in March 2000 at 8.2. Tech was all the rage back then. The Nasdaq 100 more than doubled in five months before peaking in March 2000. Fast forward to 2020, after stocks bottomed in March, tech again became a go-to sector, rallying nearly 84 percent into September’s all-time high of 12439.48. In that month, the ratio reached as high as 7.8 before heading lower (Chart 5). In due course, this has the potential to become an important reversal. If so, if nothing else just because of the sector’s weight, this will matter for the whole stock market, as it did in 2000.
For now, all these three indices mentioned here have reached an important spot. A breather here should not be so surprising. On the Russell 2000, for instance, those who top-ticked the August 2018 high waited two-plus years to break even. It is natural for this level to generate new supply. Small-cap bulls should be able to deal with this if indeed money is leaving growth and into value. If so, 1600-plus once again is the one to watch. This price point, going back to January 2018, has proven to be important, and should be used as a buying opportunity if investor mood has genuinely shifted toward small-caps.
Alternatively, the indices manage to bust through resistance – the S&P 500 through 3580s, the Nasdaq 100 through 12000 and the Russell 2000 through 1740s – take out stops, rally a bit more before fatigue sets in. Signs of it are already appearing. Last week, the S&P 500 formed a weekly long-legged doji.
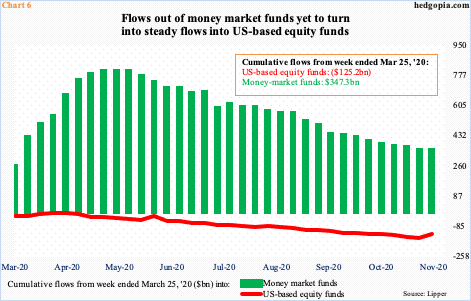
Amidst this, for a change, in the week to last Wednesday, $23.8 billion moved into US-based equity funds. After rising to a record, money market assets have been falling since May. But not much has moved into equities.
Chart 6 uses cumulative flows from the week to March 25. Despite the massive rally in equities since, equity funds have continued to bleed. So, if last week is the beginning of a trend, there is a lot of so-called dry powder out there. This is the best-case scenario for equity bulls. Even in a breakout scenario immediately ahead, flows likely need to cooperate.
Either way, a breather is probably due – either right here or post-breakout.
Thanks for reading!
