
The December 13th Fed pivot lit a fire under risk assets, leading equity shorts to cover and ETF inflows to jump. Flows, however, began to turn negative as the new year began. This does not help the equity bulls, even as the major US equity indices are at/near their highs.
The FOMC will meet on January 30-31. This is the first scheduled meeting this year; interest rates are expected to be left unchanged at a range of 525 basis points to 550 basis points. Rates have already gone up a ton.
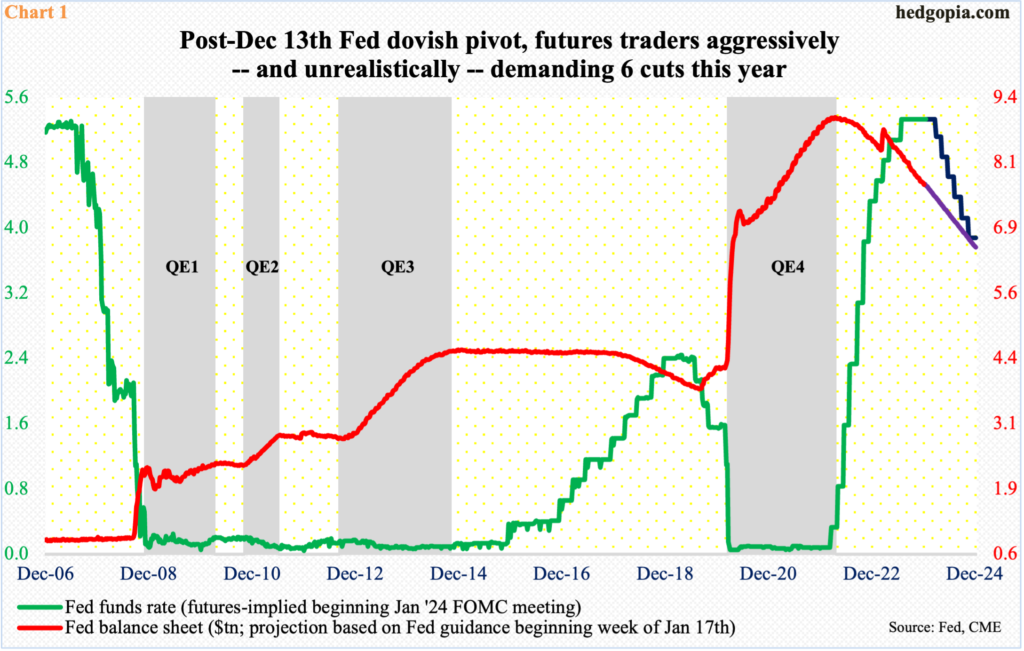
When the Federal Reserve began tightening in March 2022, the fed funds rate stood between zero and 25 basis points. The central bank is also reducing its balance sheet, which – assuming the current guidance remains in place – is on pace to reach $6.5 trillion by the end of the year, down from $9 trillion in April 2022 (Chart 1).
The last hike took place last July. But the December 12-13 meeting, when the benchmark rates were left unchanged, marked a crucial dovish turn by the Fed nevertheless. The central bank, which had already dropped hints that they are likely done in this cycle and that the next move will be lower, made a distinctly dovish turn, with the dot plot expecting three cuts this year, up from two during the September meeting.
In reaction, futures traders immediately raised probabilities of rate cuts this year to six, up from four going into the meeting. In the latest week, they are currently vacillating between six and seven cuts. This is too aggressive – and probably unrealistic. But various asset classes, including equities, have already rallied, taking a cue from the futures market.
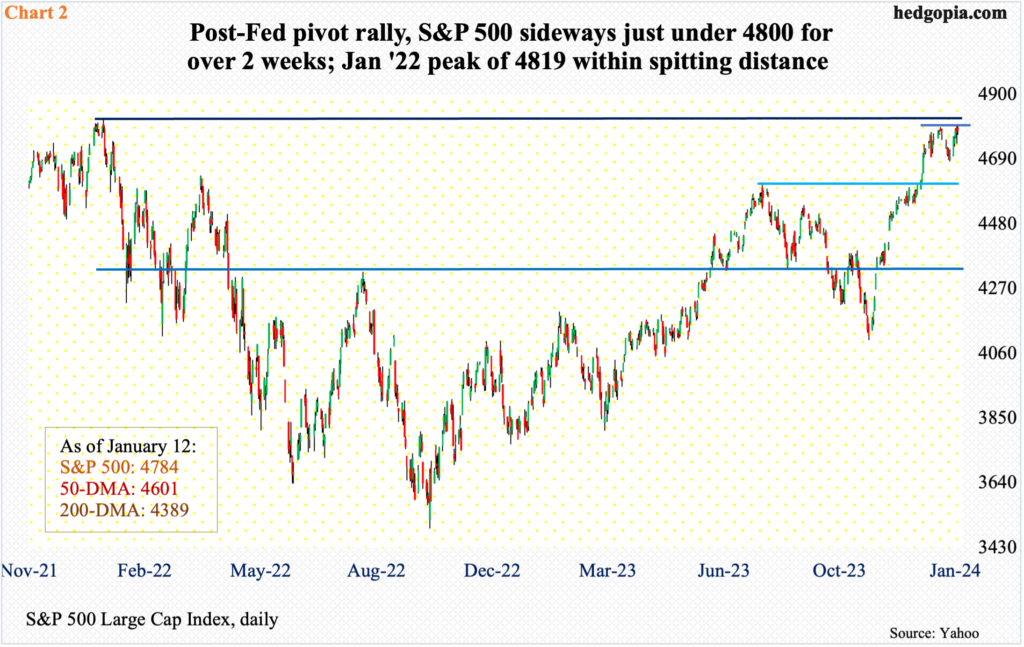
The S&P 500 bottomed last October – on the 27th at 4104. Earlier, the large cap index lost 27.5 percent from the January 2022 peak of 4819 before bottoming at 3492 in October that year. From that low, the index rallied to 4607 last July and retreated, giving back nearly 500 points to last October’s low. Then, one after another, resistance fell.
Anticipating a dovish switch by the Fed, equity bulls pushed the S&P 500 past the July 2023 high on the Monday of December’s FOMC week (Chart 2). Come Wednesday, the Jerome Powell-led policy setting body acquiesced, sounding more dovish than expected. More equity gains followed. By the 28th, the S&P 500 ticked 4593, before coming under slight pressure to drop to 4682 by the 5th this month.
Last week, the S&P 500 jumped 1.8 percent to 4784, touching 4802 intraday Friday – less than 17 points from the January 2022 peak. In essence, the index made a round trip in a little over two weeks, going essentially sideways. The Fed pivot did its trick. The bulls now need a new tailwind.
In fact, equity bulls should be happy how things have evolved in the futures market since last month’s FOMC meeting.
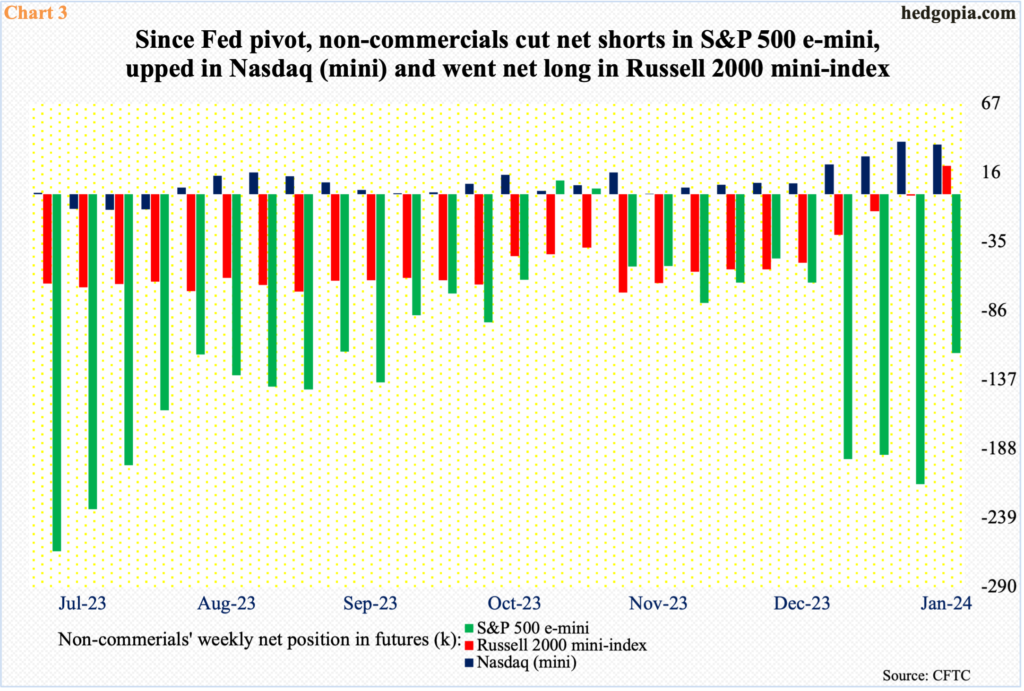
In the week of the Fed pivot (as of December 12th), non-commercials were net short 65,083 and 50,629 contracts in e-mini S&P 500 and Russell 2000 mini-index futures, and net long 8,104 contracts in Nasdaq (mini) futures. Fast forward four weeks, as of last Tuesday (January 9th), these holdings have respectively changed to 117,049 net shorts, 21,012 net longs and 36,776 net longs (Chart 3).
Net shorts in e-mini S&P 500 are higher versus the week of the pivot, but they dropped 97,039 contracts week-over-week last week. Most noticeably, after remaining net short since March 2021, non-commercials switched to net long Russell 2000 mini-index futures last week. This obviously helped the respective indices perform positively last week. But, will this continue?
The same question can be asked of what is transpiring in the ETF land.
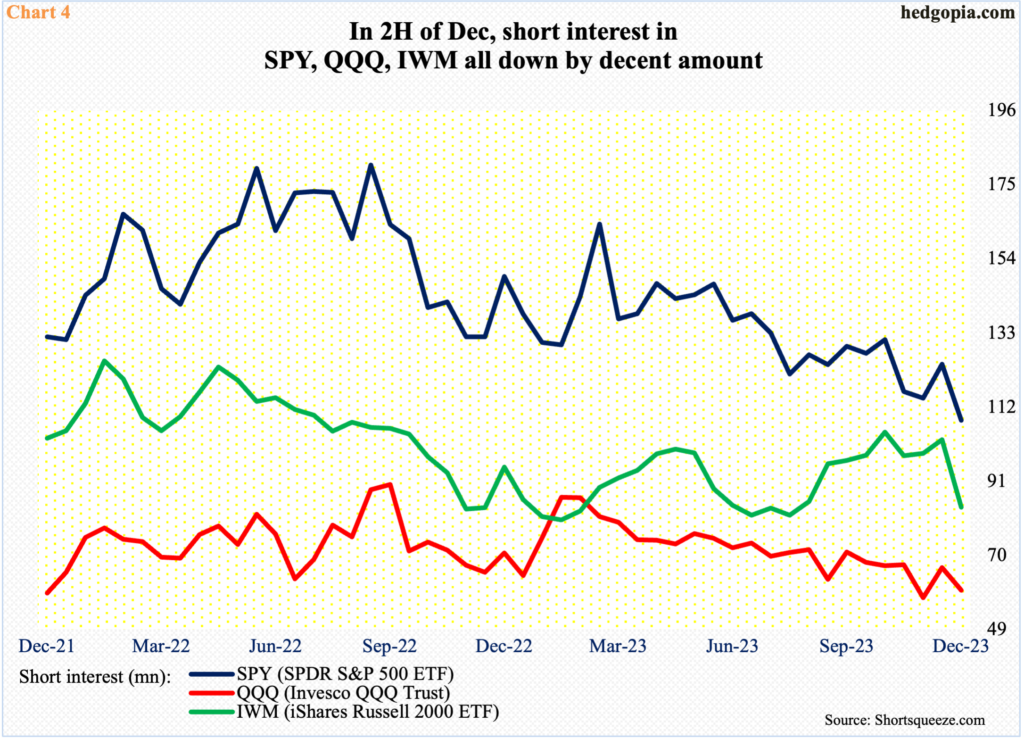
Mid-December, short interest in SPY (SPDR S&P 500 ETF), QQQ (Invesco QQQ Trust) and IWM (iShares Russell 2000 ETF) all rose period-over-period – respectively from 114.6 million to 124.2 million, from 58.1 million to 66.5 million and from 98.9 million to 102.8 million, as shorts were not convinced of the staying power of the pivot tailwind. They changed their mind in the second half as these ETFs/indices continued to press higher.
At the end of December, short interest declined to 108.3 million in SPY, 60.1 million in QQQ and 83.7 million in IWM (Chart 4). The question is, will this continue? If it does, this will obviously bring good news to the bulls – particularly considering the S&P 500 is at such a crucial juncture.
Not surprisingly, flows hold the key, and after a sharp increase post-pivot, they are now acting tentative.
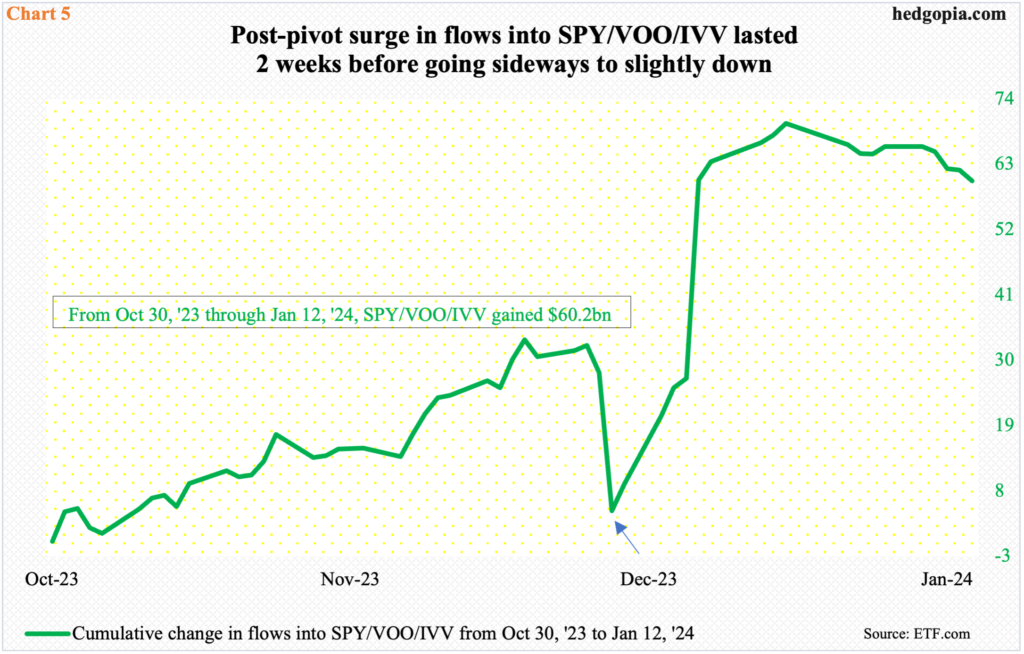
Chart 5 presents combined flows into SPY, VOO (Vanguard S&P 500 ETF) and IVV (iShares Core S&P 500 ETF) from October 30th last year (the S&P 500 bottomed on the previous Friday on the 27th). Through December 14th – a day after the pivot on the 13th – the three ETFs had attracted $4.6 billion (arrow). Then, they began to build up. By the 28th, $69.9 billion had come in, before momentum began to decelerate as the new year began.
The surge in effect lasted a couple of weeks. As things stand, the right side of the green line in the chart is not what the bulls want to see. They will need it to turn up. Else, this will in due course begin to get reflected in these ETFs/indices.
More and more evidence is piling up that the post-pivot jump in equities was caused by short-covering in combination with a spike in flows, pushing indices like the Nasdaq 100 to new highs and the S&P 500 to within spitting distance of the January 2022 high. Judging by the flows data, the excitement around the pivot is dissipating, even as the indices remain near their highs. This will sooner or later catch up with the indices.
Thanks for reading!
