
Sentiment indicators are beginning to come in from elevated levels. This both preceded and followed the latest three-day selloff in stocks. Wednesday, bulls tried to stem the damage by buying. Immediately ahead, VIX is the one to watch.
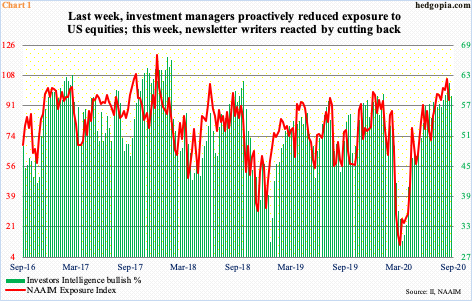
Last week, NAAIM (National Association of Active Investment Managers) members pulled back their bullish horns from multi-year highs. They were proactive. The NAAIM Exposure Index fell 11.85 points week-over-week to 94.71. The preceding week’s 106.56 was the fourth highest reading in the series’ 14-year history. The data is published each Wednesday. As of this writing, this week’s reading was not published yet. Last week, these pros, who manage money for a living, cut exposure to US stocks right before the selloff on Thursday and Friday. Selling continued this week. From Last Wednesday’s record high of 3588.11 through Tuesday this week, the S&P 500 large cap index dropped 7.2 percent, while the Nasdaq 100 index tumbled 11.1 percent.
The abrupt three-day selloff obviously impacted Investors Intelligence bulls, who reacted this week by dropping 2.5 percentage points to 59 percent. This survey is as of Tuesday. Last week’s 61.5 percent was the highest since October 2018.
In both instances, bulls have begun to retreat from lofty levels, so there is a long way to go before the existing optimism is unwound. In the week to March 18, the NAAIM Exposure Index was down to 10.65, while Investors Intelligence bulls reached 30.1 percent in the week to March 24 (Chart 1). Major equity indices bottomed on March 23.
Sentiment is not going to deteriorate in a straight line. It is likely to occur over weeks, even months. After the sharp three-session decline, indices tried to stabilize Wednesday, with the S&P 500 up two percent and the Nasdaq 100 up three percent. Before this, the latter closed Tuesday right on the 50-day, while the former was 17 points from the average.
At this stage, more important is how these indices behave at/near shorter-term averages. On the S&P 500 (3398.96), Wednesday’s intraday high of 3424.77 was sold at the 20-day (3431.14). The index also remains under the 10-day at 3469.19. This is also the case with the Nasdaq 100 (11395.85), with the 10- and 20-day at 11857.57 and 11623.13 respectively.
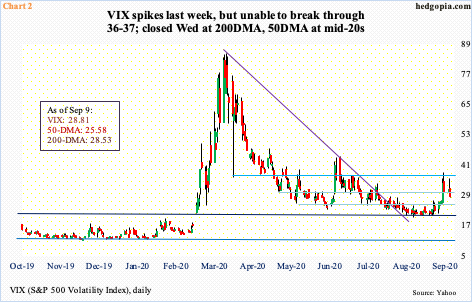
Immediately ahead, VIX is the one to watch. Last Friday’s high of 38.28 broke through 36-37 resistance intraday but could not seal the deal, closing down 2.85 points to 30.75, even though equities were down in that session. Tuesday, the volatility index – once again – rallied to 35.93 intraday but only to close at 31.46, for a shooting star session. Come Wednesday, VIX dropped 2.65 points to 28.81, essentially closing on the 200-day (28.53).
By the time VIX staged a mini reversal last Friday, the daily had entered overbought condition, which is being unwound. If equity bulls can regroup and muster strength, there is room for volatility to go lower. The 50-day in particular lies at 25.58, which lines up with horizontal support. Longer-term, VIX has room to go a lot higher.
Thanks for reading!
