As Jerome Powell indicated imminent tapering but not rate hikes, small-caps were bid up last Friday. The Russell 2000 is rangebound within a rectangle. A breakout can cause short squeeze. Should one occur, bulls need cooperation from the A-D line.
After collapsing in the early months of last year, the US economy roared back with a vengeance. Several metrics recovered to surpass the pre-pandemic highs. Real GDP tumbled to $17.3 trillion in 2Q20; four quarters later, it rose to $19.4 trillion – a new high. In July, the ISM manufacturing index fell 1.1 points month-over-month to 59.5, which was the first sub-60 reading in six months; in the same month, the non-manufacturing index increased four points m/m to 64.1, for a fifth consecutive 60-plus reading. Similarly, retail sales snapped back from a post-pandemic low of $409.8 billion in April last year to $628.8 billion – a new record – in April this year, with July at $617.7 billion.
Jobs are yet to post a new record nonetheless have witnessed a sharp recovery. In July, 943,000 non-farm jobs were created, coming on the heels of June’s 938,000 addition. With this, from the post-pandemic low of 130.2 million in April last year, 16.6 million jobs have been created. This is still 5.7 million less than the record high of 152.5 million from February last year.
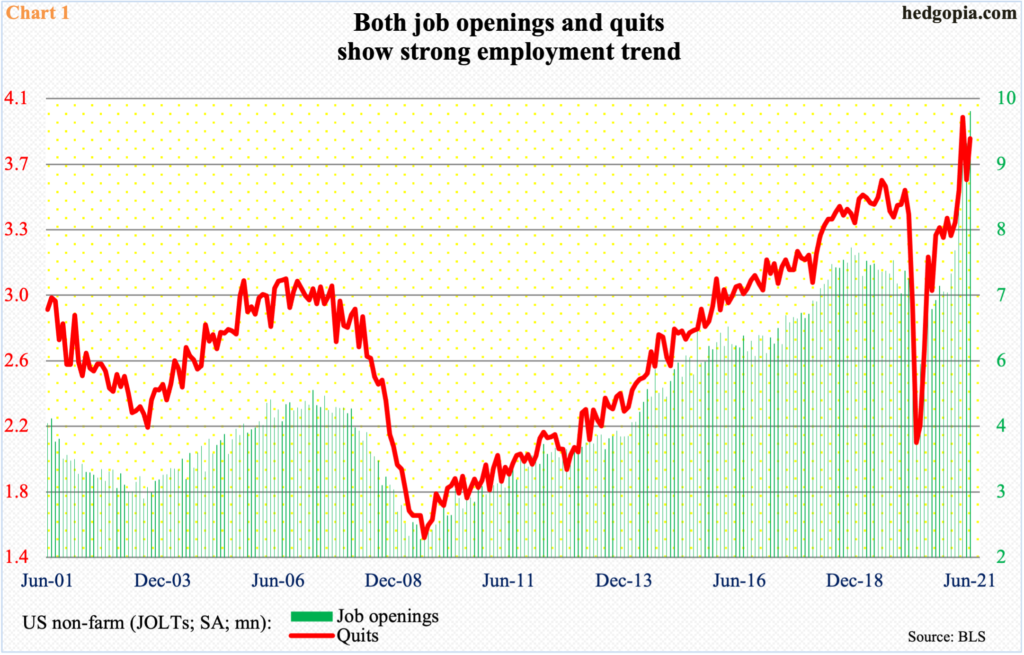
That said, non-farm job openings are at a new high, with June up 590,000 m/m to 10.07 million; quits, too, rose 239,000 m/m to 3.87 million, having posted a new high of 3.99 million in April (Chart 1). In general, workers would not quit unless they are confident of finding a new job relatively easily. This speaks of the optimistic mindset they are in currently. The record job openings speak of the economy’s resilience.
Small-cap earnings are a testament to this. By nature, small-cap businesses have larger domestic exposure than their larger-cap cousins, which are also exposed internationally.
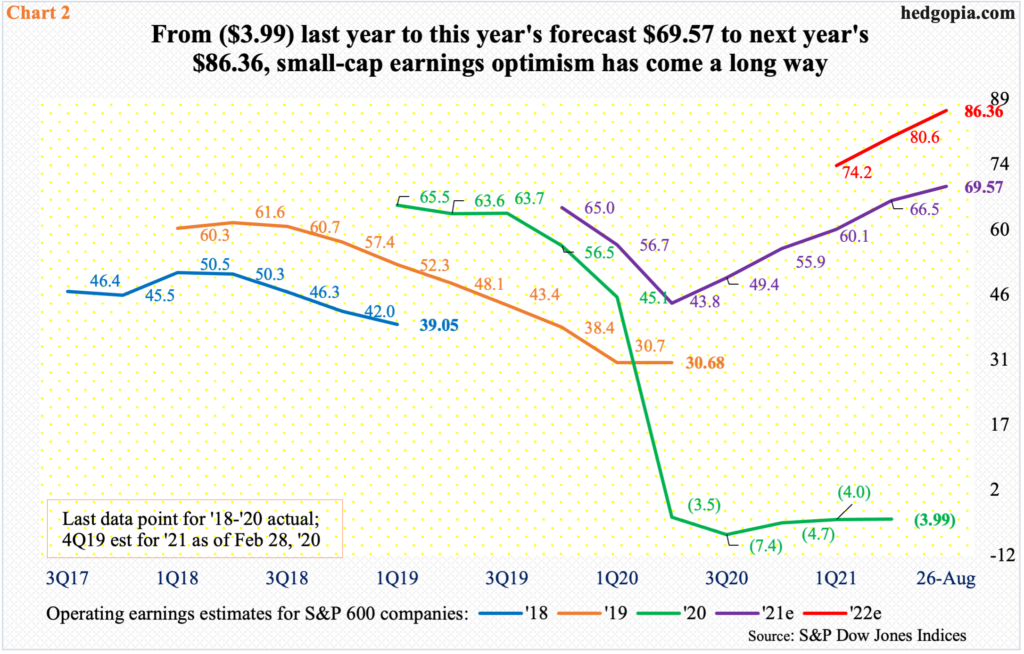
Last year, S&P 600 small cap companies lost $3.99. Earlier in February 2019, these companies were expected to ring up as much as $67.63. But estimates collapsed as Covid-19 ravaged the economy. This year’s estimates were $64.96 in February last year before coming under pressure and then bottoming at $42.99 mid-July last year. Since that trough, the upward revision trend has been persistent. With two quarters to go this year, 2021 blended estimates are $69.57. This is obviously quite a U-turn from last year. Sell-side analysts expect the momentum to continue next year. They are penciling in 24.1-percent growth to $86.36 for 2022 (Chart 2).
But stocks are not quite responding.
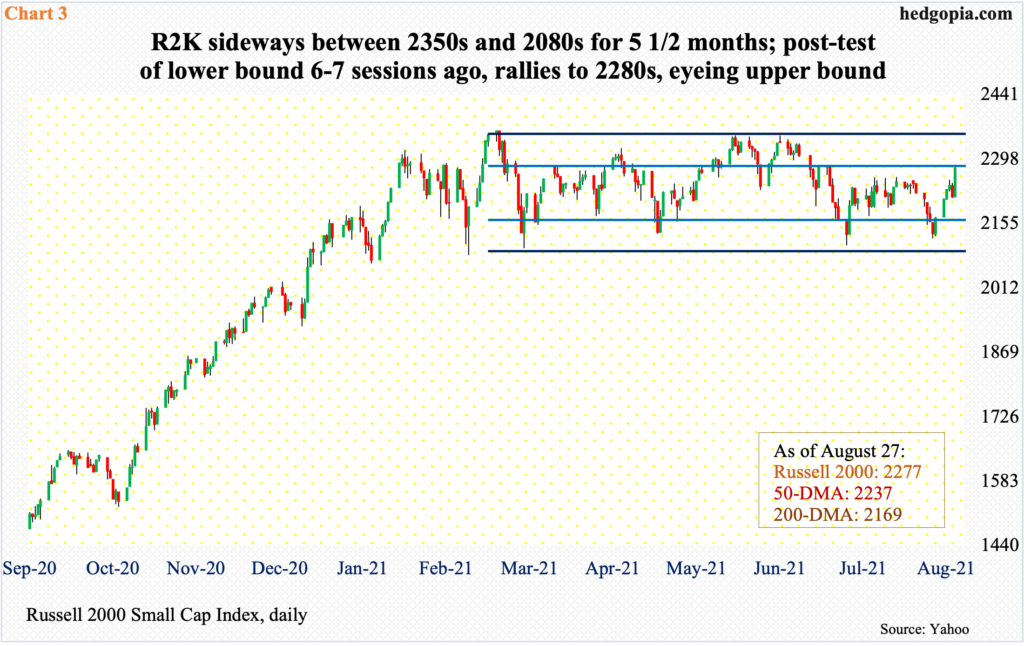
The Russell 2000 has been going back and forth between 2350s and 2080s for five and a half months. On August 19-20, the lower bound was just about defended, as a drop to 2120s was bought. Last week, the small cap index (2277) shot up 5.1 percent, past 2250s and closing right on 2280s resistance. A breakout opens the door toward the upper bound of the box (Chart 3).
A decisive breakout – should one materialize – will have come after digestion of massive gains since the Russell 2000 bottomed at 960s in March last year. A year later, mid-March this year, it peaked at 2360, up 144 percent. If the current consolidation is part of a continuation pattern, ambitious bulls would in due course be eyeing 3700-3800. That is a long way from here, and plenty needs to fall into place for this to come true.
Last Friday, help came from Jerome Powell, Federal Reserve chair. At the Jackson Hole symposium, he indicated that the central bank is getting ready to taper its bond purchases by the end of the year.
Currently, the Fed buys up to $80 billion in treasury notes and bonds and $40 billion in mortgage-backed securities. It is sitting on $8.3 trillion in assets, nearly twice what it held in March last year.
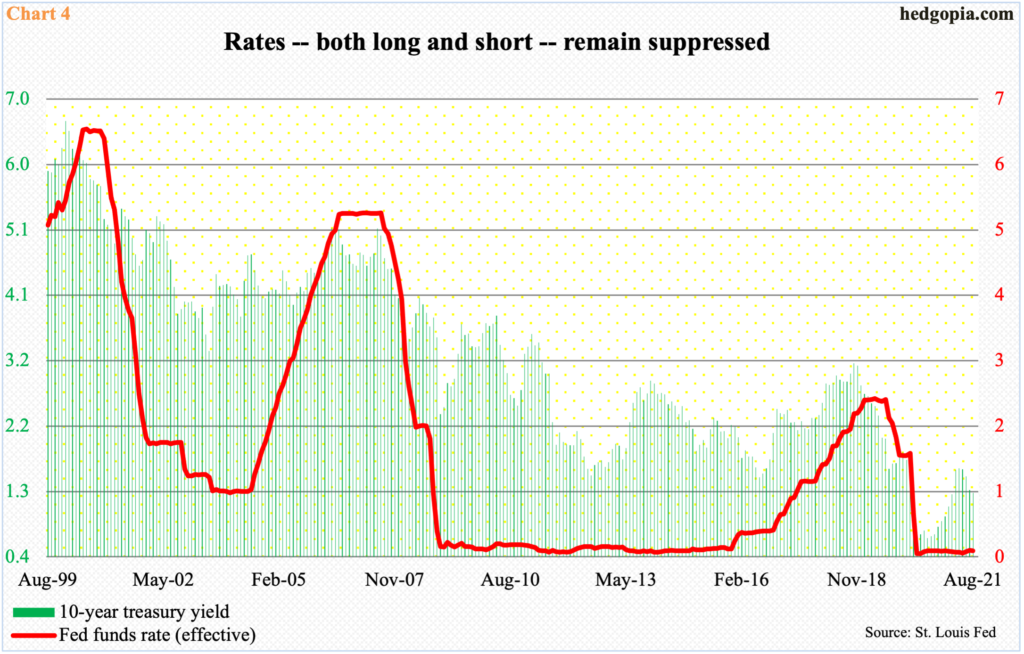
Equity bulls were fearful that the announcement – even suggestion – of tapering might adversely impact stocks. Instead, the S&P 500 large cap index rallied 0.9 percent last Friday. As did bonds as the 10-year treasury yield fell three basis points to 1.31 percent. The Russell 2000 shot up 2.9 percent.
Equities probably paid more attention to something else Powell said – that rate hikes are not imminent. He said there is “much ground to cover” before that happens. Removal of QE is stealth tightening, but demand dynamics for treasury securities are complicated. Tapering in and of itself may or may not result in upward pressure on the long end of the yield curve. The next step logically is a rise in the fed funds rate, but as Powell suggested, it can be a while before that happens.
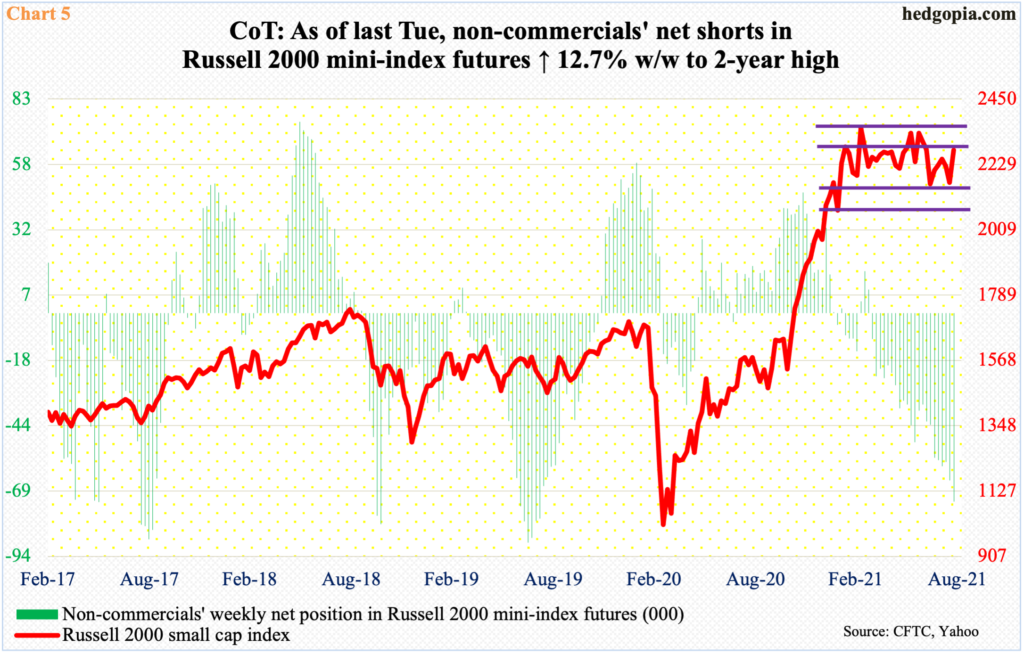
Equity shorts who thought tapering would cause a selloff were in for a surprise last Friday. It is possible the jump in the Russell 2000 was the result of non-commercials covering their shorts in Russell 2000 mini-index futures.
As of last Tuesday, these traders were net short 72,931 contracts – a two-year high (Chart 5). If last Friday’s rally did not tempt them to reduce their holdings, a takeout of 2280s potentially can, more so if the index breaks out of the current consolidation.
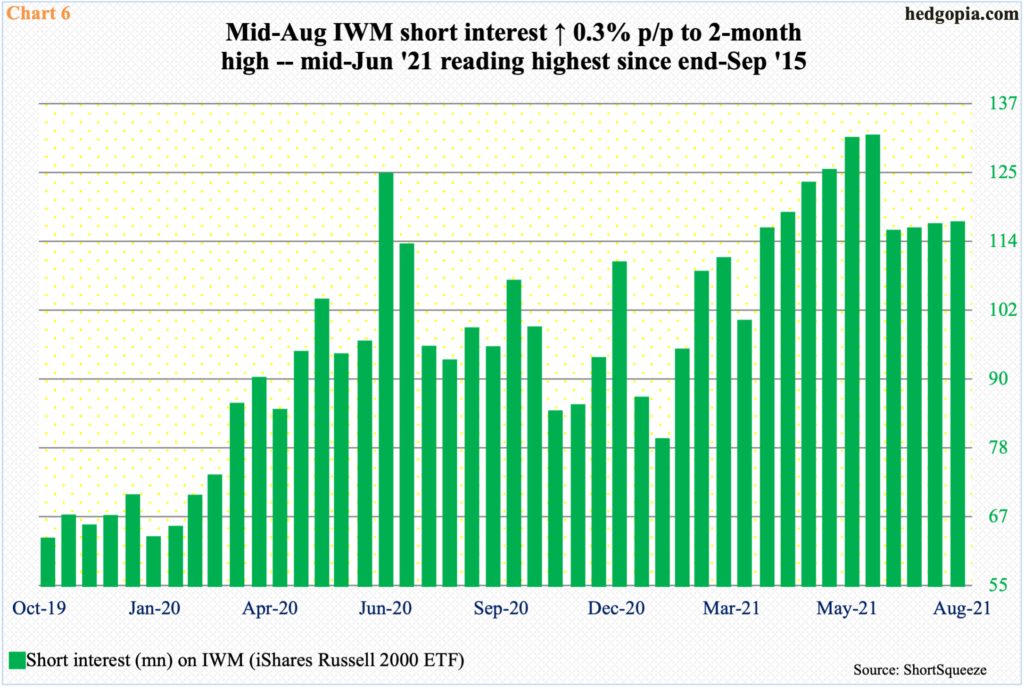
Potential squeeze fuel also lies in IWM (iShares Russell 2000 ETF) short interest, which rose 0.3 percent period-over-period mid-August to 115.8 million. This is lower than the mid-June reading of 130.5 million, which was the highest since end-September 2015, but remains elevated (Chart 6).
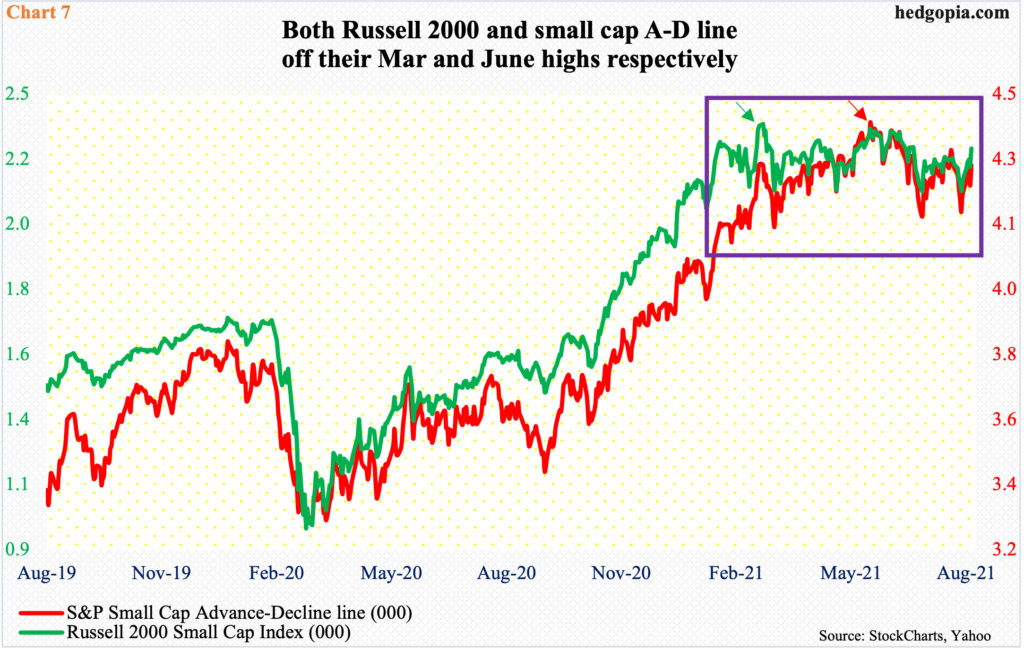
Should a breakout occur, one metric to keep in mind is the S&P small cap advance-decline line.
Currently, both the A-D line and the S&P 600 small cap index are below their June highs. Chart 7 uses the Russell 2000, which peaked in March with a test of that high in June. The two metrics are moving in unison. Bulls would want to keep a close eye on this relationship and would not want to see a divergence in which the Russell 2000 breaks out and the A-D line fails to cooperate.
Thanks for reading!

